Economics, The Art Of Deception Vs. Demographics, The Simple (Yet Ugly) Reality
- Population growth is the main driver of economic growth, and population growth is ending in developed nations and slowing in developing nations.
- As core 16-54 year old population growth ends, oil consumption has peaked and declined indefinitely, indicating slowing economic activity.
- Interest rate cuts and debt are substituted for decelerating population growth... but population growth is not coming back in our lifetime. Thus, how will ever fewer repay ever more debt?
- The Federal Reserve's economic ineptitude has likely resulted in a self-reinforcing negative cycle of deflation, depression, and depopulation with unknowable depth, duration, and collateral damage.
The quantity and quality of population growth is primarily what one needs to know to understand changes in global demand and subsequent supply. To understand a global or national economy, quantity (number of participants or population) plus quality (income, savings, plus leverage or credit) tells the story. The caveat being that changes in wages and credit for the existing population plus trade balances also play a role in growth.
Still, the tiny marginal change in population (in relation to the total population) has impacts magnitudes larger than the numbers suggest. Population growth is the primary driver for all increases in demand, from housing, to cars, to consumer goods, to large infrastructure build-ups to accommodate all these.
Quantity of Growth
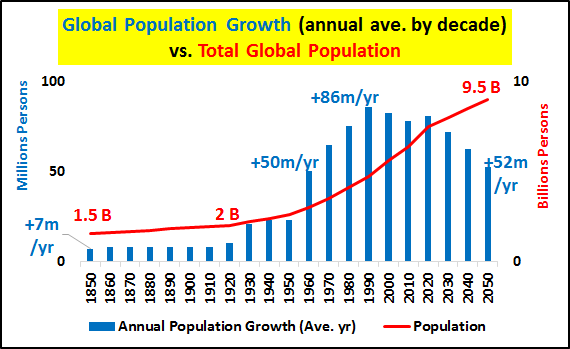
Population growth is pretty much the nexus of all GROWTH. Funny, we hear so little about demographics and yet so much about growth?!? Consider, the below chart shows the quantity of global population growth (yearly average by decade) from 1850 to 2050 versus total global population (all population data and estimates are via OECD.stat). Annual global population growth peaked in the 1980s, and by 2050, is set to decelerate back to the same gross growth as in the 1950s (despite a total population three times larger than that of the 1950s).
Quality of Growth
The chart below shows both total global growth and a breakdown by 0-64 year olds versus those in the 65+ year old category. Growth in the 0-64 year old segments represents true population growth (incoming births over outgoing old... 65+), while 65+ growth represents those living longer, thanks to improved medicine, nutrition, fewer wars, etc.
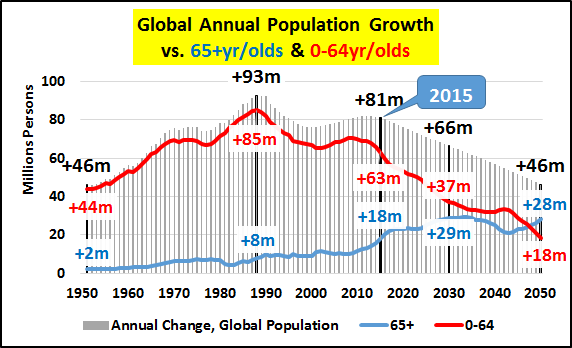
However, 65+ year olds are typically leaving the workforce to draw on retirement in developed nations or be supported by their children in most developing nations. Either way, the "QUALITY" of their consumption level and willingness to utilize credit declines precipitously after 65, and they generally exhibit weak levels of growth in demand.
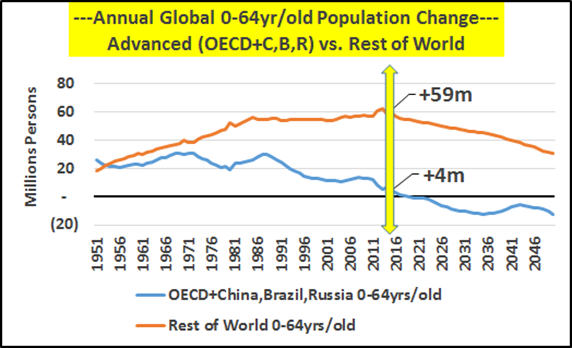
Likewise, the chart below shows where the growth in the 0-64 year old global population is happening. Said otherwise, where the QUALITY of growth resides (quality simply used to mean the ability and resources to consume). The collective population growth among the wealthier nations of the OECD, plus China, Russia, and Brazil is moving toward zero, followed by decades of population decline. About 90% of the decelerating 0-64 year old growth is taking place in Africa, India, and the poorest nations on earth.
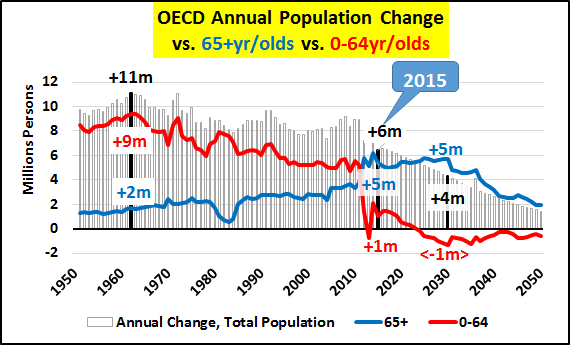
The chart below outlines the collective OECD members population growth and the makeup between those under 65 and those over 65. Deceleration and declines among the younger core population offset by growth of 65+ segments is plainly visible.
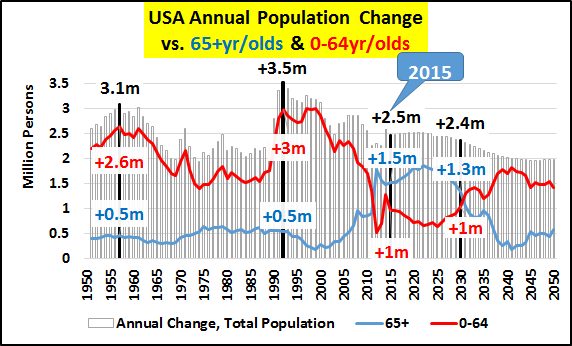
In the chart below, the US annual population growth peaked in 1992, when 85% of that growth was under 65 years old. US population growth has fallen by about a third since that peak, but the makeup of that growth has reversed itself. Now, 60% of that growth is among the 65+ year olds living longer, and less than 40% among greater quantities of 0-64 year olds. This trend continues for at least another decade.
So, as the wealthy nations of the world saw decelerating population-driven growth and slowing economic growth, they turned to the developing markets for additional growth. And these developing nations looked to grow via utilizing cheap wage-driven exports back to the wealthy nations. Chief among them being China.
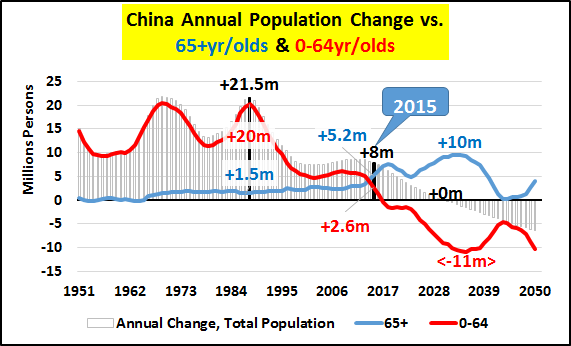
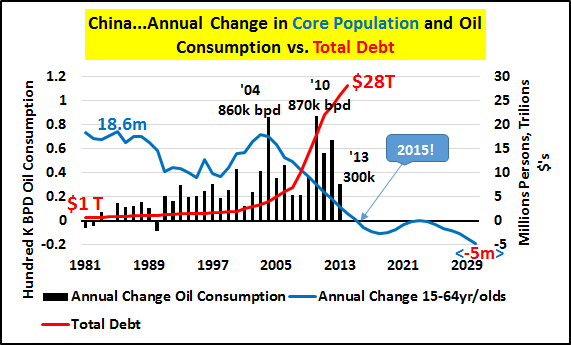
China's annual population growth peaked in 1988 with the addition of 21.5 million Chinese that year. 90% of that year's growth was among the under-65 segment. Compare that with 2015's total annual population growth, which fell 60% to 8 million. The 65+ year old growth now represents 2/3rds of all Chinese population growth, and growth among the under-65 year olds has fallen nearly 90% since that 1988 peak. The numbers only get significantly worse (from a growth standpoint) from here. China's role as an engine of growth is over.
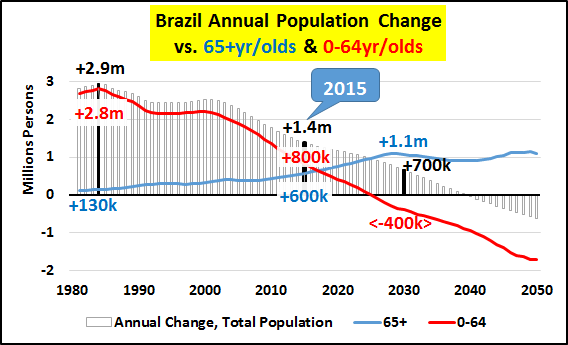
Brazilian demographics look like Chinese demographics (and China looks an awful lot like Japan).
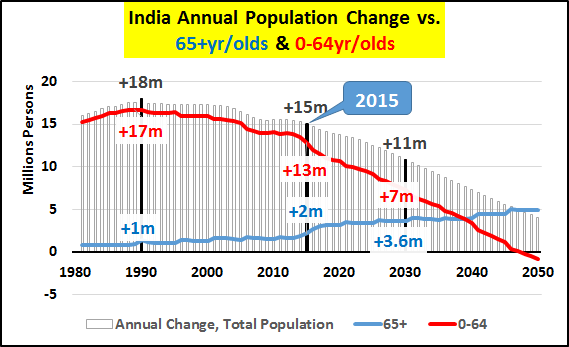
Indian annual population growth peaked in 1990, and will continue decelerating indefinitely... declining numbers of the young being hidden by rising numbers of the old.
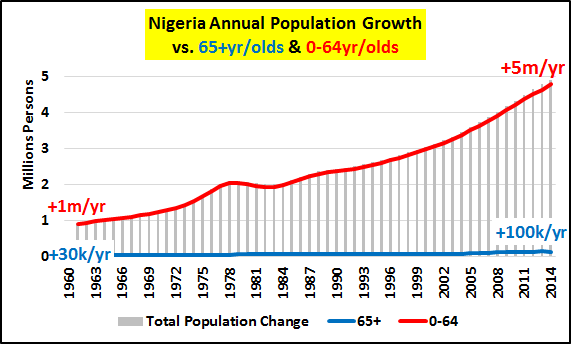
Africa (well represented by Nigeria in the chart below) will be responsible for the vast majority of global population growth now and in the coming decades. In particular, it will produce the vast majority of 0-64 year old population growth. The same Africa where 1/3rd of the nations have annual income below that of Haiti and continent-wide per capita income is under $5000/year.
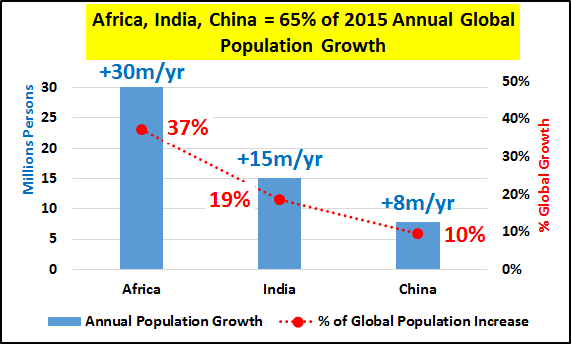
In 2015, Africa represents 37% of the global population increase, but 45% of global 0-64 year old population growth.
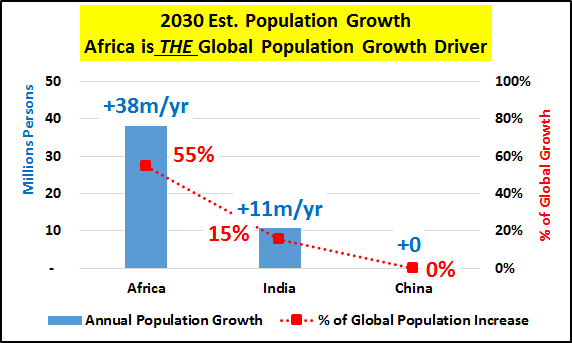
By 2030, the chart below highlights that Africa will represent an est. 55% of global population growth... but far more importantly, in 2030, Africa will likely represent 90% of all 0-64 year old population growth. A continent without income, savings, access to credit, and dwindling-growth nations to purchase their exports. Given these circumstances, the likely "quality" of African consumption and demand growth will be almost nil, and the global impacts of declining demand are only accelerating.
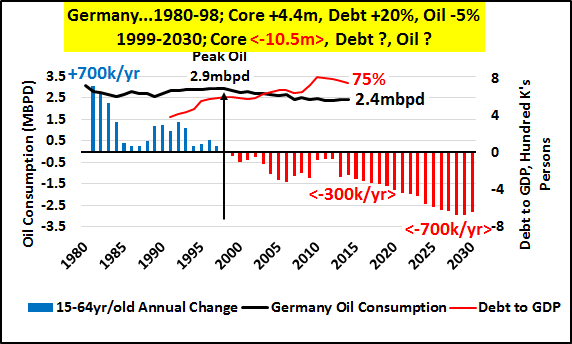
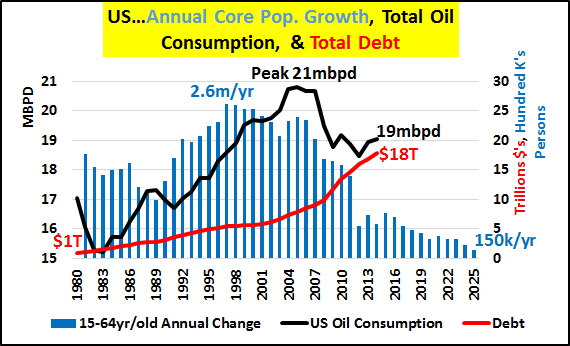
Population Growth Ends... Oil Consumption Peaks and Declines in Sympathy
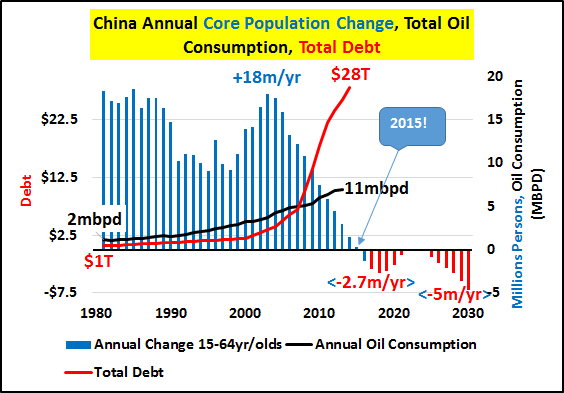
When the 15-64 year old core population growth peaks, stalls, and or outright declines, oil consumption falls (despite overall populations continuing to grow). This triggers central bank interest rate cuts to incent increases in credit and debt in an attempt to maintain consumption, leveraging up the system among flattening or declining populations. However, if we look at oil consumption in the below charts as a proxy for economic growth... it ain't working now, and it really isn't going to work given what's upcoming.
FYI, the charts below show annual changes to the core population, total oil consumption, and total debt.
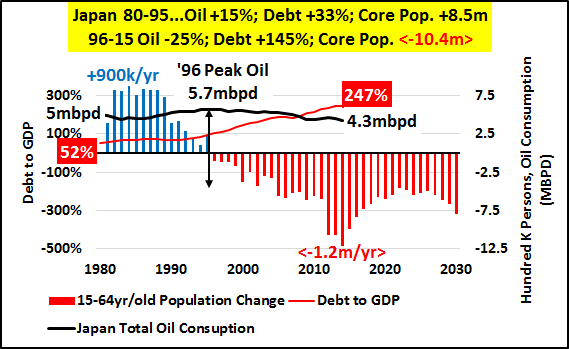
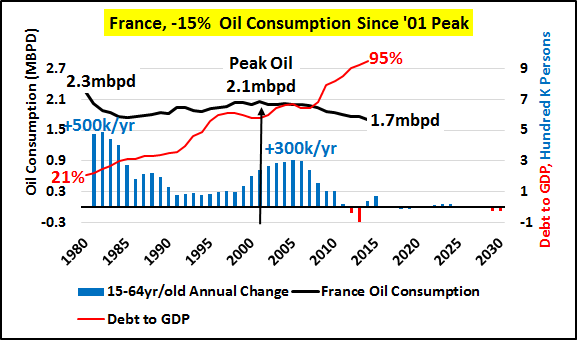
I could go on and on with developed nations following this pattern... but all that really matters is China. The country was the last great engine of growth. China followed the developing to developed pattern, with slowing core population masked by the greatest credit / debt increase in history, but the credit binge has gone bust. So, a declining core population, a housing-driven credit bust, and slowing global export markets are why Chinese peak oil consumption is very likely in 2015 or 2016, and China (like Japan) will no longer see organic growth or increasing consumption of much of anything.
The Fed Made the Inevitable Transition into a Catastrophe
I have gone a fair ways to outline that population growth was a limited feature that is now coming to an end. Central banks' models premised on the fallacy that this is a cyclical downturn rather than the structural revolution from high population to low/no population growth are entirely mismanaging fiscal and economic policy.
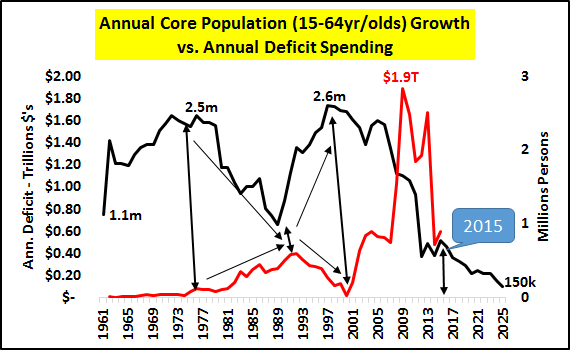
The chart below makes it plain that US federal deficit spending (and periods of slowing economic growth) has been used to offset what are simply periods of slow core population growth.
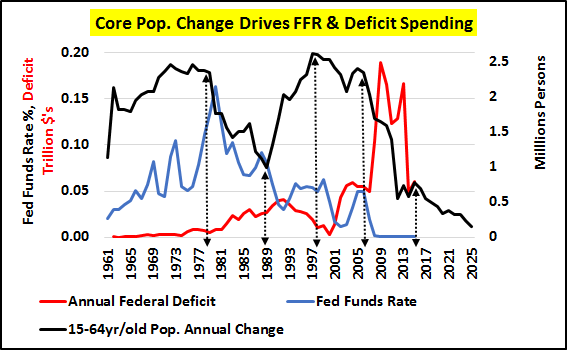
And worst of all, the Federal Reserve is simply hiking and lowering the Federal funds rate to incentivize this credit and debt in lieu of core population growth (chart below). However, the US core population will be at its slowest growth since well before WWII (and this assumes continued lax US immigration policies), and the globe (x-Africa) will be slowing even more dramatically. Larger federal deficits and lowering of interest rates have been the only answer (now coupled with QE) the Fed has known to this natural slowing of the population.
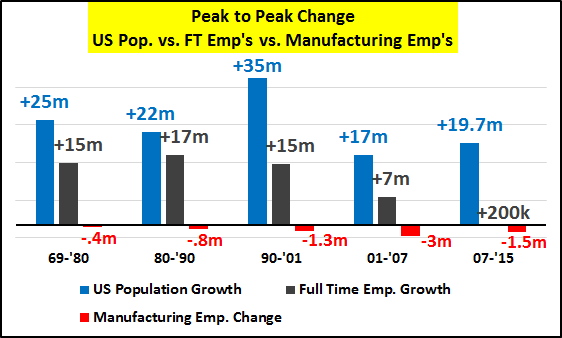
And US (and global) employment will continue to slow due to this slowing demand, coupled with innovation, technology, outsourcing, etc. The chart below shows the peak to peak population, full-time, and manufacturing jobs since 1970. It's plain to see that job creation capable of facilitating family formation (full-time, manufacturing, etc.) is slowing in relation to population growth. In short, a world needing ever more consumers is consistently creating fewer good jobs (not to mention little-to-no wage growth). How those without good jobs can consume is our modern-day conundrum.
And just because I tire of the false argument that declining jobs are due to Boomers retiring.
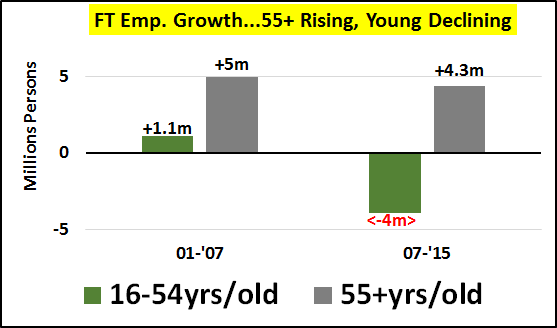
The chart below highlights that although there have been no net full-time job gains since 2007, the 55+ year olds have taken over 4 million full-time jobs at the expense of 4 million jobs lost among 16-54 year olds. The old are experienced and continuing to work to maintain their benefits, in order to augment their insufficient retirement funds and COLA-less SS benefits.
The core generation is being left to chose from part-time and service industry positions that will never allow them to be strong enough to support economic growth, fund the tax base and unfunded liabilities, or family creation.
Conclusión
Slowing population growth, particularly among the under-65 crowd, is the malady that afflicts the economic and financial world, and is the reason central banks are now doing back-flips to sustain the unsustainable system they created. However, now debt is maxed out and massive Fed interest rate-created overcapacities are resulting in deflationary and depressionary economic activity, meaning a self-reinforcing negative cycle is underway, of which the depth, duration, and collateral damage are simply unknowable.
Typically, a recession or depression would rebalance supply with demand, but this has always been amid population growth and the rising demands of this new, larger populace. In this case, demand is likely to continue falling indefinitely with falling populations. This means supply will need to consistently shrink until some equilibrium is found. Quite a pickle the Fed and the central banks have driven us into.
The Fed could never have avoided the population slowdown, but it clearly should have never goosed post-WWII decades that were already aided by secular demographic tailwinds. In fact, its actions should have been entirely opposite slowing growth with rate hikes to have all the tools available to us now. This would have avoided the overleveraged induced overcapacity reality we face. Instead, the Fed has left us not only without options for the demographic headwinds we face, but the bills for its prior ineptitude are now due when we can least pay them.
This is why Negative Interest Rate Policies, or NIRP, are almost a sure bet in the US and worldwide.
Corporations and banks which now get ZIRP will be paid to take money and buy up their own stock as well as US Treasuries. Simply put, we are now in a world with more sellers than buyers, who are asset-rich and cash-poor, so central bankers have determined they will pay the largest entities to maintain the bid and ensure that asset prices continue rising. Mortgage rates will fall to new all-time lows. Savers and investors will be locked into their positions by the reality (not fear) that selling and moving to cash will result in sure losses as rates only go NIRP'ier. Of course, this will almost certainly result in the greatest financial "bull market" ever coinciding with economic depression.
Of course, this is a Potemkin world, or maybe more simply, a global, central bank-run Ponzi where new customers are running short and will soon run dry. Central banks are representing the greatest and wealthiest among us, and are "all in" on the perpetuation of this Ponzi.
Unfortunately, new and entirely worse policies (for the vast majority of the world) will likely follow NIRP unless fundamental and foundational changes are made.
0 comments:
Publicar un comentario