Why Is The U.S. Importing So Much Silver Bullion??
by The Doc
May 21, 2015

Something VERY interesting took place during the first two months of 2015…
From the SRSRocco Report:
U.S. silver bullion imports increased significantly compared to the same period last year. Now, this has nothing to do with the supposed increase of JP Morgan silver inventories as that took place starting in March.
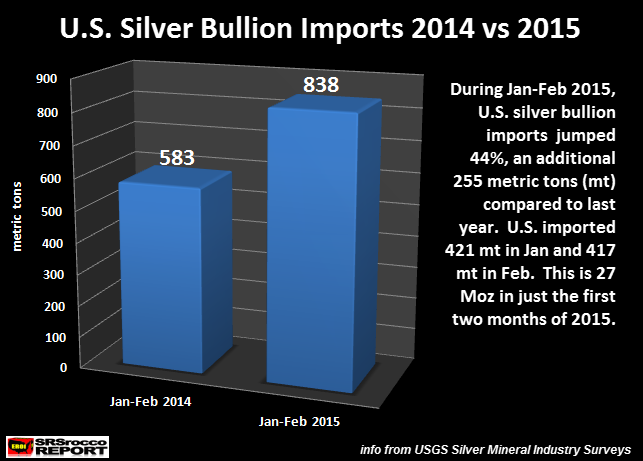
During the first two months of 2014, the United States imported 583 metric tons (mt) of silver bullion, 335 mt for January and 248 mt in February. This turns out to be 18.7 million oz (Moz) of silver bullion. However, something changed in 2015.
The U.S. imported 421 mt of silver bullion in January and 417 mt in February. This was an increase of 255 mt, or 8.2 Moz…. in just two months. Why would the U.S. be importing more silver bullion? That’s an excellent question. First, let’s take a look at where this silver came from.
Last year, of the total 583 mt of U.S. silver bullion imports (Jan-Feb), 562 mt came from Mexico and Canada. These two countries accounted for 96% of the total. If we look at the chart below, we can see the change in 2015.


While Mexico and Canada still account for the majority of silver bullion imports (82%), the U.S. also received a significant amount from S. Korea (54 mt), Poland (40 mt), Bolivia (30 mt), Germany (18 mt) and Peru (8 mt). Why did the U.S. need to access additional silver bullion from these countries when it didn’t have to last year?
1) U.S. Industrial silver consumption continues to decline
2) U.S. Silver Eagle sales were flat year-over-year.
3) Comex silver inventories Jan-Feb net build was only 1.3 Moz
According to the recently released 2015 World Silver Survey, U.S. industrial silver fabrication continued to fall in 2014. Total U.S. silver fabrication declined from 138 Moz in 2011, to 132.7 Moz in 2012, 127.4 Moz in 2013, and down again in 2014 to 125.4 Moz. So, if the U.S. Q1 2015 GDP growth was only 0.2%, I would imagine U.S. industrial silver consumption also declined.
Now, if we look at the change in U.S. Silver Eagle sales… this doesn’t help us either. The U.S. Mint sold a total of 8.5 million Silver Eagles in the first two months of 2014 and 2015. As we can plainly see, no need for more silver at the U.S. Mint.
How about the Comex silver inventories? In the beginning of 2015 the total Comex silver inventories stood at 175.5 Moz, but by the end of February, increased slightly to 176.8 Moz.
This small net increase of 1.3 Moz also doesn’t explain the need for additional U.S. silver bullion. Not all the Comex silver depositories are located in the United States, but even if they were, it doesn’t make much of a difference anyhow.
Well, there you have it. U.S. industrial silver consumption probably declined during the first quarter of 2015 while Silver Eagle sales were flat year-over-year and there wasn’t much of a build in Comex silver inventories. So, why did the U.S. import an extra 255 mt of silver in Jan and Feb this year?
Could the answer have something to do with U.S. silver bullion exports? Let’s see. During the first two months of 2014, the U.S. exported a total of 61 mt of silver compared to 126 mt during the same period this year. So yes, the U.S. exported an extra 65 mt of silver (Jan-Feb) in 2015.
However, this still leaves us with a net import of nearly 200 mt of additional silver bullion.
If we go over all the data, there doesn’t seem to be a satisfactory explanation for the large increase of U.S. silver bullion imports, unless someone is stockpiling silver for various reasons.
One more thing…
The U.S. also imports a considerable amount silver in the form of dore’ bars. Silver dore’ bars are semi-pure bars created at the site of a mine, then shipped for further refining. Total silver dore’ bar imports during Jan-Feb 2015 were 207 mt. Thus, the U.S. imported a total of 1,040 mt of silver bullion and dore’ bars in the first two months of 2015 compared to 769 mt during the same period last year.
According to the USGS, the United States imported a total of 4,960 mt of silver in 2014. If the U.S. continues to import silver at the current rate (1,040 mt Jan-Feb), it would equal over 6,200 mt for the year. Again, why have U.S. silver imports surged in 2015 when the market indicators clearly show a flat or even slightly declining demand for silver?
I will say this… I won’t speculate that JP Morgan is the big silver corner as Ted Butler has claimed in several of his last articles. While I applaud Ted for his work on the silver market over the past several decades, I disagree with him on the issue that JP Morgan has been the big buyer of silver including Silver Eagles and Maples since 2011.
I spoke with several leading precious metals dealers on the internet (who have good working relationships with the Authorized U.S. Mint participants) and they tell me that they haven’t heard anything that would give them the impression that JP Morgan purchased over 100 Moz of Silver Eagles and Maples in the past three years.
Regardless, U.S. silver bullion imports are on the rise and there has to be a good reason. I will continue to monitor the situation and provide updates in the future.
0 comments:
Publicar un comentario