The Beginning Of The End
Apr. 2, 2015 9:14 AM ET
Summary
- Selling pressure in the US equity markets has increased.
- We have just notched our 9th consecutive quarterly gain in the S&P 500, the longest such streak since 1998.
- While the US has lagged, international equities have begun to outperform.
With the first day of trading for Q2 now in the books, on the back of weaker than estimated data on hiring and manufacturing, markets welcomed participants with an April Fool's day loss of -0.40% for the S&P 500. Such price action in recent months, coupled with what we are seeing in the underlying sectors of the markets have led some to suggest the markets may be overdue for a much needed reset, such as the one we saw from July to September of 1998 when the S&P 500 posted an 18% decline (when last we saw the longest streak of consecutive quarterly gains broken). Albeit painful, the markets went on that year to recover and finished with a wildly impressive annual return of greater than 28%! Keep in mind this was the go-go 90's, when large cap US stocks averaged an annual return of over 18% and investors could seemingly throw darts at a board of potential stocks and come up a big winner. This is certainly not the 90's and we can only hope for such luck, as over the past three years the S&P 500 has already posted returns of 16%, 32%, and 13%, and we are now into our 7th year of consecutive gains in the US markets.
In our most recent article, "Playing The Strong Dollar With Currency Hedged ETFs", we made reference to the fact that since last the markets were making all-time highs in October of 2007, the S&P 500 is up over 155%, while at the same time the MSCI EAFE Index is flat, and the MSCI Emerging Market Index is negative. At some point in time we can expect these trends to reverse, and likely when we least expect it. Year to date, even in dollar terms, we may have already seen this begin to take place as the EAFE posted a total return of more than 5x's greater than the S&P 500 (up 4.88%) for Q1, and even the MSCI Emerging Market Index was up more than 2x's greater than the US (up 2.24%). It is not as though the headline news out of the Eurozone or many of the emerging market countries has been overwhelmingly positive (quite the contrary), and yet we are still beginning to see a measure of outperformance in a possible long overdue reversion to the mean. Should the overwhelming strength we have seen in the US dollar in recent months continue, investors in international equities can increase returns further by using a number of the rapidly growing currency hedged ETFs.
Now that we have set the stage and put into context the current state of the markets, as we do at the end of every quarter, let's take a look at what we believe to be some of the more notable underlying trends and divergences currently taking place in the markets. These undercurrents often go unnoticed by many investors, but in practice we believe may provide us with keen insights as to what is really going on out there.
Notable Observations:
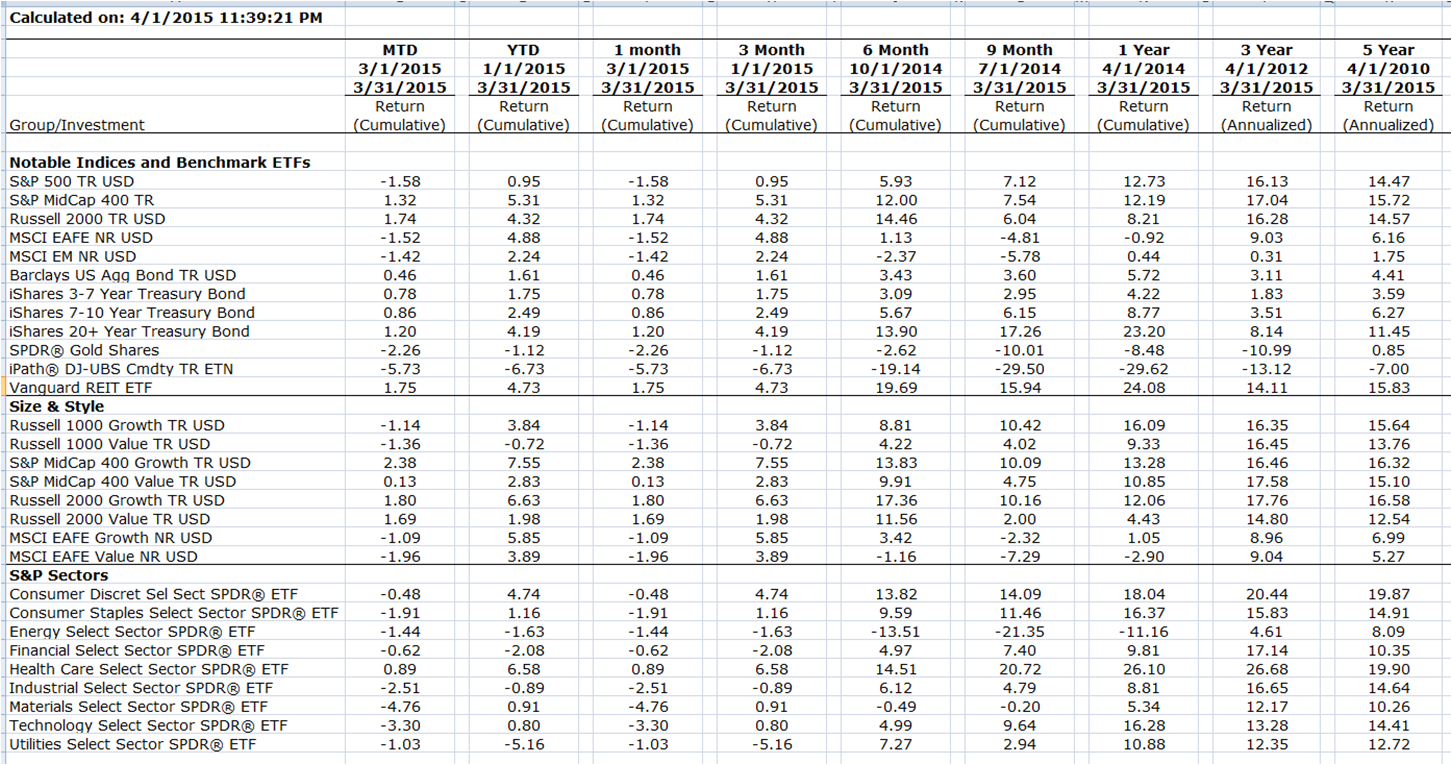
- From a capitalization standpoint, after severely lagging large caps in 2014, we have seen some strong relative strength in domestic small and mid cap stocks so far in 2015. While the S&P 500 is only up slightly less than 1%, the Russell 2000 is up 4.32% and the S&P Mid Cap 400 is up 5.31% on the quarter. Even in the last month where the S&P 500 once again turned negative, down -1.58%, the Russell 2000 managed to turn in a gain of 1.74% and the S&P Mid Cap 400 was up 1.32%.
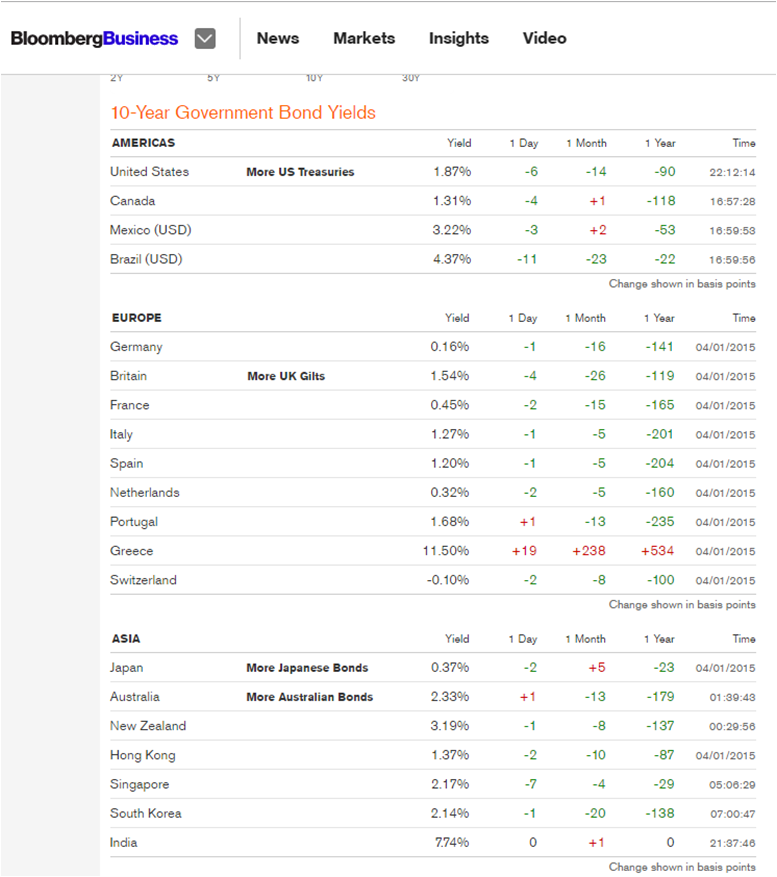
- Despite the increased whispers and potential headwinds that upcoming rate hikes can cause for fixed income, the iShares 20+ Year Treasury ETF (TICKER: TLT) continues to outperform the equity markets. In 2014, when large cap US stocks (as measured by the S&P 500) seemed to be nearly the only broad equity benchmark to notch double digit returns globally, up over 13%, TLT was up over 27%. So far in 2015 this trend has continued, as TLT finished Q1 up more than 4x's better than the S&P 500, with a return of 4.19%. However, after beginning the year up 9% in January, TLT quickly dropped by 9%, before recovering to provide investors with another solid quarterly return. On a side note, for all of the academics out there waiting for the shoe to drop on Treasuries based on the fundaments of duration, etc. - consider the global demand for high quality bonds and the fact that similarly rated and respected paper issued by foreign governments pays considerably less than US Treasuries. For example, as of this moment, the current yield on the 10-Year US Treasury is a historically low 1.87%, but the 10-Year German Bund pays only 0.16%. During times of peril investors seek quality and they seek yield. This could very well provide a floor for any potential losses in Treasuries and some have argued may even continue to provide legs for the current rally to continue to run.
- From a size and style standpoint, for the past nine months we have noted our preference for growth over value. In this regard, traditional asset allocators should be overweighting growth (if only modestly) due to the fact that value has been trading at a premium above historical valuations and growth has been trading below its historical median. For investors who have heeded this advice, they have benefitted from the pronounced divergences in the returns of growth versus value in recent months. For Q1, the Russell 1000 Growth TR Index is up 3.84%, while the Russell 1000 Value TR Index is down -0.72%; the S&P Mid Cap 400 Growth TR Index is up 7.55%, while the S&P Mid Cap 400 Value TR Index is up 2.83%; and the Russell 2000 Growth TR Index is up 6.63%, versus a return of 1.98% for the Russell 2000 Value TR Index. If you stretch this timeline out even further, consider over the past 3 quarters the Russell 1000 Growth TR Index is up 10.42%, versus a return of 4.02% for the Russell 1000 Value TR Index; the S&P Mid Cap 400 Growth TR Index is up 10.09% versus 4.75% for the S&P Mid Cap 400 Value TR Index; and the Russell 2000 Growth TR Index is up 10.16%, while the Russell 2000 Value TR Index is up only 2.00%. A great resource for investors to check which capitalizations and styles are currently trading above or below historical averages (as well as a number of other insightful statistics) is the quarterly report published by JP Morgan, entitled "Guide to the Markets".
- From a sector perspective, the outperformance we have seen in the health care sector year to date, over the trailing 1-year, 3-year, and even 5-year periods has been nothing short of astounding. Consider that over all 4 of the measurement periods cited the health care sector outperformed all of the other eight S&P 500 sectors! In many cases it was not even close. As illustrated by the returns of the Health Care Select Sector SPDR ETF (TICKER: XLV), through Q1 this security lead all other sectors up 6.58%; over the trailing 1-year XLV lead the markets up 26.10% (roughly 8% better than the next best performer); trailing 3-year average annual return of 26.68% (more than 6% better than the next closest sector); and over the trailing 5-year period posted a leading average annual return of 19.90%. While there are certainly better ETF options out there than taking a cap weighted sector approach, most investors will most readily identify with the State Street sector ETFs since they are the oldest and most heavily traded. That said, in our recently published article "Choosing The Right Health Care ETF" we discuss this further and provide investors with a process and criteria to follow when assessing sector based ETFs.
- We should also note, the leading sector in the markets in 2014 was the utility sector. As measured by the Utilities Select Sector SPDR ETF (TICKER: XLU), this sector was up over 28% last year. However, this year XLU has been the worst performing sector in the S&P 500, down through Q1 by -5.16%. After such a great year last year, it may likely come as little surprise to see the utility sector lag so far in 2015, particularly when one considers that the utility sector is much more interest rate sensitive than many of the other sectors, and therefore with more talk about interest rate hikes in the near future, selling has increased in recent months. Energy, financials, and industrials represent the only other S&P sectors posting negative returns year to date.
(click to enlarge)
So is this the beginning of the end? Will we finally see our streak of consecutive quarterly gains come to an end? No one can say for sure, but history would tell us we are likely closer to the end of that trend than the beginning. At which point it becomes far more difficult for investors to commit to the equity markets, fearful they may be buying in at the top. At the same time, conventional wisdom would tell you that with potential increases in interest rates not too far off on the horizon, fixed income may soon come under pressure as well. This presents an obvious conundrum for investors and likely explains why we have seen such tremendous growth in the tactical managed ETF portfolio segment of the market in recent years, as these portfolios tend to be increasingly nimble, with the potential to adapt to current market conditions based on underlying trends. We presented the fundamental thesis behind these moves in our book, Asset Rotation, published by Wiley & Sons last year, and we further provided examples of this in our recently published article, How To Beat The Markets Using Tactical Asset Rotation.
The bottom line is that investors need to be aware of the inherent risks present in both the equity and fixed income markets today, and they also need to become educated as to what they can do to more efficiently navigate what we believe will be a far more difficult landscape going forward than we have experienced in recent years.
0 comments:
Publicar un comentario