Feb. 21, 2015 2:59 PM ET
Summary
- Analysts have recently called for all kinds of oil price recoveries: V-shaped, L-shaped, W-shaped.
- US shale oil was the main driver of global excess supply, but now the number of active oil rigs fell off a cliff.
- Global demand remains weak and supply high.
- High storage build will delay any impact on prices once demand picks up.
- Shale technology is very flexible and shale oil wells will come back on stream quickly once prices recover.
V-Shape: US Shale Main Driver of Excess Supply
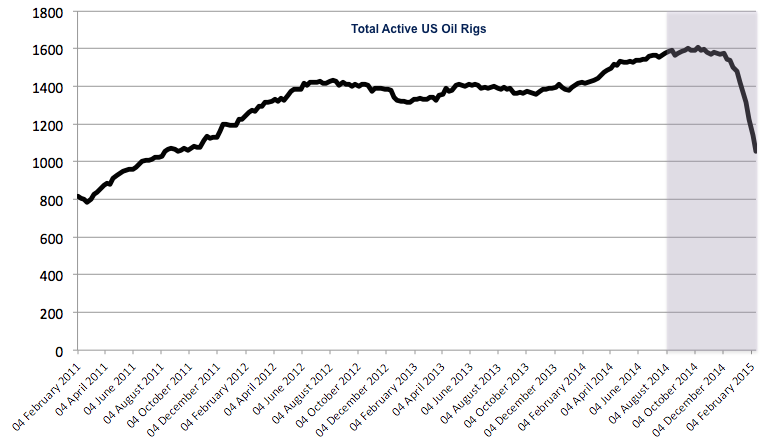
So what are the respective arguments? Kepler argues that US shale oil was the main driver of global excess supply, but has been hit substantially by the low oil price. The industry is now in a severe crisis if you look at data provided from Baker Hughes (NYSE:BHI). Kepler looks at the number of active oil rigs in the US which has fallen off a cliff since December. The peak was reached in October with a total of 1,609 rigs drilling for oil. Since mid-December, the rig count fell every week and the fall has accelerated through January. The two charts below show the total number of active US oil rigs and the weekly change over the last 4 years.
(click to enlarge)
(click to enlarge)
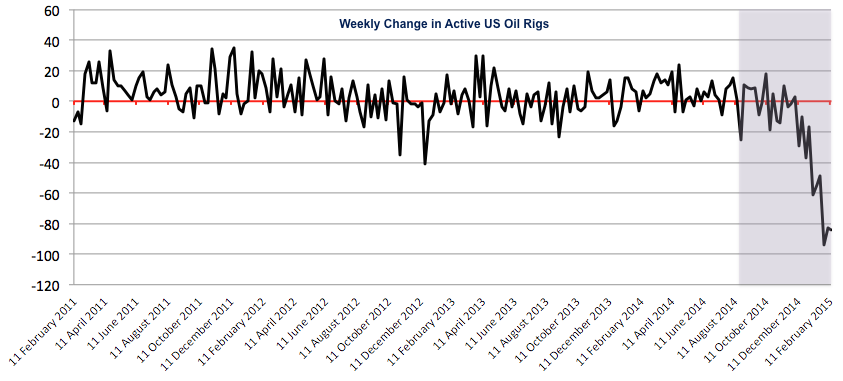
(Source for both charts: Baker Hughes)
US shale oil has been the primary driver of excess supply. Shale production increased from 0.6 mb/d in 2008 to 4.7 mb/d in 2014. Without US shale, global oil supply would have been 72.6 mb/d last year which compares to 73.6 mb/d in 2005. The following chart illustrates this once more: the increase in global oil supply over the past few years was almost entirely due to US shale oil production. Kepler argues that the fall in active US oil rigs is a leading indicator of US oil supply and, thus, we should see prices recover as the number of active rigs falls and excess supply abates.
(click to enlarge)
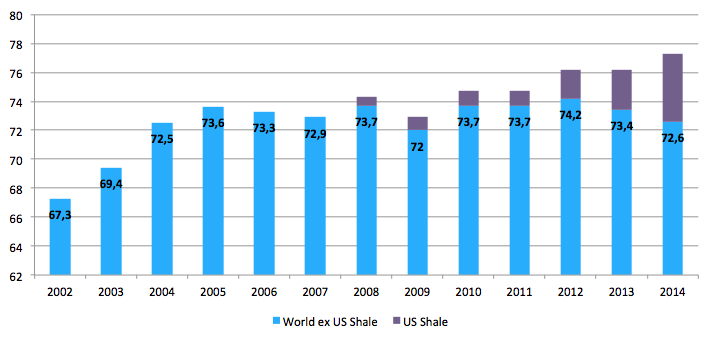
(Source: EIA US Energy Information Administration)
So Kepler argues for a V-shaped recovery starting from the middle of the year. They do not expect it to happen immediately as the fall in active rigs has to feed through into actual production and some new rigs are still about to be completed.
However, once the impact of a dramatically lower rig count starts feeding through into shale oil supply from the middle of the year, prices should start to rally on a more sustained basis, with Brent likely to be back at $75 by year-end.
L-Shape: Lower For Longer
On the other hand, we have less optimism coming from Goldman Sachs and BP, the British oil company. Goldman COO Gary Cohn said in late January:
We're probably in the lower, longer viewTheir intuition is the following: if you are a consumer, you want to lock in the currently low prices and hedge more than you usually would. That means there is a high demand for oil futures for delivery in say a year's time. On the other hand, if you are a producer and you see a decently steep forward curve with prices 10-20% higher for delivery in 12 months, you also want to lock in that forward price. So there is not just ample demand, but also supply of oil futures.
As I am writing, the forward price of a future on WTI crude oil for delivery in December 2015 is a bit more than $59. This compares to $50.96 for the March future. So December oil is about 16% more expensive. Given this incentive structure, it becomes clear that it may take a long time for prices to recover. Oil prices for an increasing amount of oil delivered in the future are being locked in, and the more contracts are traded, the less flexibility there is for prices to increase in the near future. So, the often expected rebound towards $75 by year-end seems increasingly unlikely and that explains why Goldman expects an L-shaped recovery.
BP on this same page even expects the oil price to stay in a range of $40 to $60 for up to 3 years.
BP's CEO pointed out not just to ample supply, but also to sluggish demand as China is not growing as fast as it used to anymore. Actually, it was weak industrial production data from China in the first place which made people fear that the fall in oil prices might be a demand problem too. Before that, everybody had simply been blaming oversupply. In that week, equities around the world suffered their biggest weekly losses since 2011. That highlights how much importance people assess to Chinese demand, and given this, it is not surprising that BP also expects an L-shape.
W-Shape: Flexibility of Shale Technology Poses Threat to Sustained Price Recovery
Last but not least we have the latest report from Citigroup. They view the recent surge in oil prices as a "head-fake" as analyst Edward Morse wrote. Prices could drop again to as low as $20, but will recover towards $75 until year-end.
For Citi, there are three key factors that will determine the evolution of oil price: (1) consistently high oil supply, (2) storage building, and (3) shale rigs can be redeployed quickly when prices recover.
Regarding point (1), Citi sees global oversupply to persist throughout the first half of 2015.
Despite the declining number of active US oil rigs, Russia and Brazil are pumping at record levels, and the Arab countries, such as Saudi Arabia, are more worried about maintaining their market share by cutting prices to Asia. So supply will be remain high despite the price drop.
Second (2), there is a lot of storage building which was just confirmed by the latest numbers from the EIA this week. US crude oil inventories rose by 7.7 million barrels last week to a record 425.6 million barrels. So, once demand recovers it will have to partly eat through this new storage first. This will cause a delay to any price recovery. Combined, points (1) and (2) could lead to oil prices falling towards $20 in the first half of 2015, Citi says.
(click to enlarge)
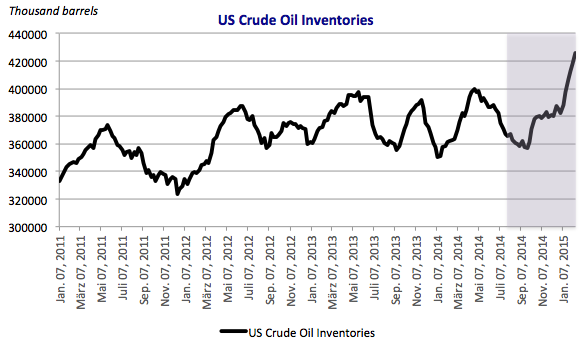
(Source: EIA)
Another important point (3), as was also highlighted by Kepler, is that it is now all about shale. The number of active US oil rigs may be falling, but that does not mean that the wells are being destroyed.
The shale technology is very flexible. Shale wells can be put back to work in a matter of months or even weeks and they drain a lot faster than conventional wells. Thus, shale production can increase and contract rapidly. So, every price increase will lead to more shale oil production and the price will fall again. This is the reason why Citi expects a W-shaped recovery.
What Shape Will It Be?
The crucial question now is: what shape will it be? Let us quickly summarize the respective arguments.
- US shale oil was the main driver of excess supply, but the number of active oil rigs has fallen substantially.
- Low prices in combination with a fairly steep forward curve provides incentives for consumers and producers to enter into more forward agreements than usual, thus cementing the current price structure.
- Global demand remains weak.
- Supply will remain high as Russia and Brazil are pumping at record levels, and countries such as Saudi Arabia are more concerned about maintaining their market share and willing to accept lower prices in favor of market share.
- High storage build will delay any impact on prices once demand picks up.
- Shale oil wells will come back on stream once prices recover.
My take from this is that shale has basically destroyed the power of OPEC to dictate prices, which is also what Citi wrote in their report. Shale has the power to be the swing factor for global oil supply. It has the power to fix the oil price to a low level because of the flexibility described above. Any time prices recover past the threshold where shale becomes profitable again, wells will be redeployed and prices will fall again, leading to cyclicality around a level substantially below $100. Previously, OPEC had the role of a price stabilizer, cutting production every time prices dropped. This kind of stabilization worked the other way round than the shale one by putting a flower on prices. Shale, on the other hand, puts a ceiling on prices. As Alan Greenspan recently wrote, shale has taken the price setting power from OPEC:
The shale technology breakthrough is likely to be a far more effective stabilizer of oil prices than the cartel of oil producing countries. [OPEC] is now relinquishing its pricing power. It may never be regained.In summary, I believe oil prices will see a combination of an L- and W-shape recovery. We will see the fluctuations of the W, but on a lower for longer level (L). Will oil be back at $75 by year-end? I do not know. Will it fall to $20? I do not know that either. But I think it is likely that prices will stay below $80 for quite some time. However, one unknown remains. We can discuss about the supply side forever. But the demand side is as important, and how that will develop is maybe even more difficult to quantify.
0 comments:
Publicar un comentario