Dec. 15, 2014 7:12 PM ET
Summary
- Oil price patterns observed during some of the previous “mega-corrections” imply that this time a decline to a $45-$55 per barrel range cannot be ruled out.
- It is difficult to expect a rapid recovery. At least three previous mega-corrections took almost two years to run their full course.
- The current correction’s structural logic does not imply that there is a fundamental change to the industry’s capacity or cost base, which are the key drivers of the long-term price.
- Where is the bottom?
- How long would it take for oil price to recover?
- Will oil return back to ~$100 per barrel level or has the paradigm changed?
Given the magnitude of the current decline - ~45% from last summer's peak levels - it would be logical to narrow down the comparison to the most significant "mega-corrections" that the industry experienced in the past several decades.
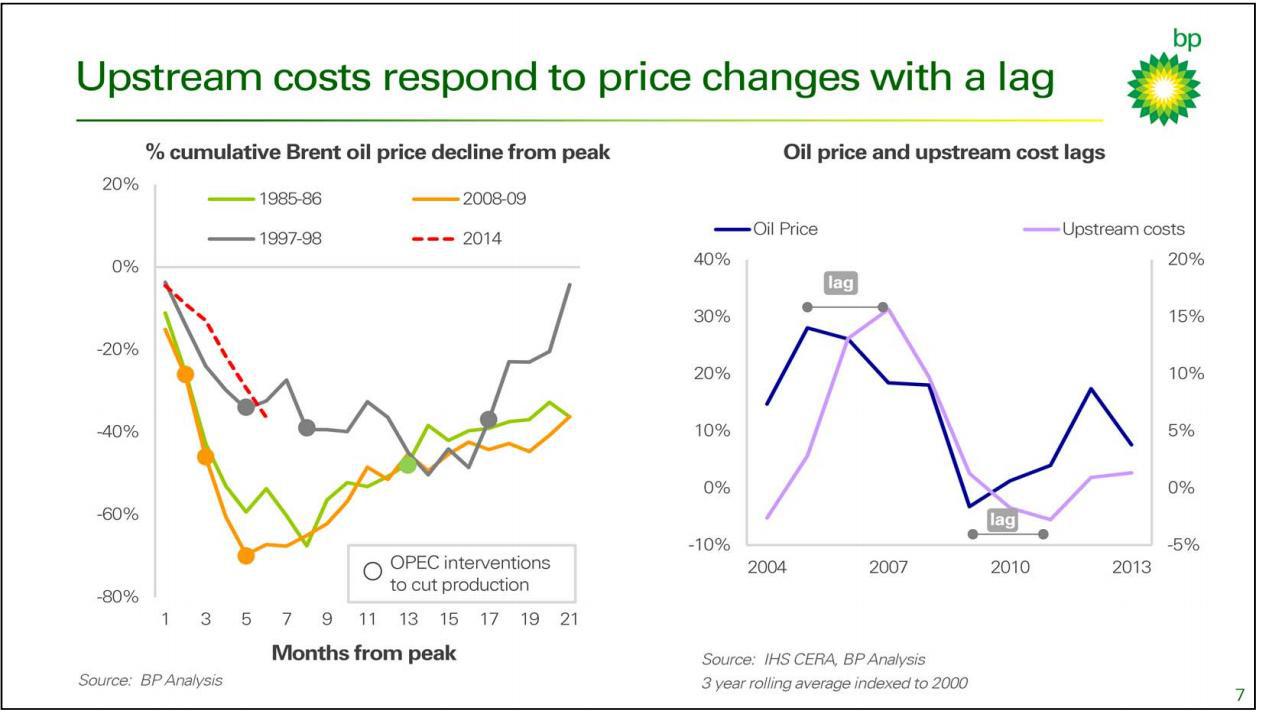
It is difficult to summarize the relevant precedents better than was done last week by BP p.l.c (NYSE:BP). The following slide maps the current oil price trajectory versus the corrections of the 1985-1986, 1997-1998 and 2008-2009 periods. Specific macro factors that caused each of those three precedent mega-corrections were of course different. However, the net effect of deep price declines experienced each time was creation of an economic signal that forced producers to reduce supply so that demand was matched. In this regard, the current oil price correction may be no different in its substance and may exhibit some similarities in terms of its structure and duration.
(click to enlarge)
(Source: BP p.l.c, December 2014)
BP highlights the fact that it has historically taken up to 2 years for prices to complete a deep decline and then undergo a recovery. In two instances out of the three shown on the left-hand side of the graph above, OPEC was forced to respond to the declines with a series of production cuts (while OPEC cut production during the 1985-1986 correction, oil price was already on a recovery path by that time).
Another important observation provided on the slide relates to the strong cyclical correlation between oil prices and the industry's costs. The graph suggests that cost changes tend to react to oil price movements with a lag of 1-2 years. BP commented that over the past 12 to 18 months, industry cost inflation had caught up with $100+ oil prices and was already showing signs of slowing, even before the recent sharp fall in oil prices. With oil prices where they are today, BP expects that this natural self-correction mechanism will lead to supply chain deflation. I should note here that BP's view of the industry's cost structure likely includes international and offshore segments where margins often have stronger contractual support and the cycle may be slower to turn around than in unconventional resource plays.
If one were to assume that the current correction will repeat the path of its historical analogues, the following observations may be derived:
- While declines appear to be more precipitous than recoveries, the 1997-1998 correction provides an example of a rapid price recovery. The graph also shows that it may take over a year for an oil price recovery to run its course. Given that oil prices began to move lower in July of this year, a 20-month downcycle would mean that oil price may not recover until approximately Q1 2016.
- The average peak-to-trough decline for the three corrections was slightly over 60%. For the current correction, a 60% peak-to-trough decline would imply a "bottom" price of approximately $45 per barrel. If one were to use the shallowest of the three corrections, the 1997-1998 one, as a benchmark, the bottom price level would be approximately 50% of the previous peak price. In the context of the current decline this would equate to ~$50-$55 per barrel. The duration of the price "bottom" is approximately 3 to 5 months.
- In two cases out of the three, one year after the low price had been reached, the price of oil was still ~30% below the previous peak price. In one case out of the three, the recovery was all the way up to the price level at the beginning of the correction. Applying the average measure to the current situation, this would imply a recovery to approximately $80-$85 per barrel level towards the end of 2015.
- From an operating margin perspective, using historical precedents, 2015 promises to be a very challenging year for the Oil & Gas industry. Operating costs will provide only moderate relief, whereas revenues will trough. The following year, 2016, should see the opposite trend: operators would benefit from a strong recovery in revenues, whereas costs may still be on a decline trajectory.
Of note, according to an October 13, 2014 Reuters article, Saudi officials had communicated in meetings with investors and analysts that the kingdom would "accept oil prices below $90 per barrel, and perhaps down to $80, for as long as a year or two, according to people who have been briefed on the recent conversations." One could interpret such message as an admission by Saudi Arabia that a significant downcycle was unavoidable at that point and the kingdom was expecting it to last 1-2 years, which would be similar to the shape of the previous major downcycles. The price expectation, however, appears somewhat optimistic when compared to previous mega-corrections.
Another recent comment by a senior OPEC official is interesting in this regard. Today's Bloomberg article quoted the United Arab Emirates' energy minister Suhail Al-Mazrouei as saying that OPEC will stand by its decision not to cut output even if oil prices fell as low as $40 a barrel and will wait at least three months before considering an emergency meeting.
What is driving this correction that seems to have caught many investors and industry participants by surprise? BP did not provide any new insights, suggesting that market fundamentals are driving this trend include:
- Increase in global supply, mainly due to the return of shut-in production "in a number of locations" - such as Libya - and continued production growth in the United States;
- Relatively high petroleum storage levels;
- Weaker demand globally (it was not quite clear from the comment whether it meant "weaker growth rate of demand globally").
Notwithstanding near-term uncertainties, BP sees this environment as potentially healthy for the industry overall as it can drive greater efficiency across the value chain and is one of the mechanisms that underpin long-range returns in the Oil & Gas sector. Despite this optimism, it is clear that this price correction caught the industry by surprise and it will take operators some time to make adjustments to their business plans.
BP's example provides an illustration. The company commented that it sanctions its Upstream projects assuming $80 per barrel, at which level the company expects a project to generate "competitive returns." The company also tests each project at $60 per barrel to understand the resilience of its portfolio at a range of prices. With oil currently trading below $60 per barrel, many of BP's projects will likely fall below the return threshold.
In March of this year, BP planned to spend ~$24-26 billion per annum between 2015 and 2018, of which $20-22 billion related to the Upstream. In October, BP told analysts that it would pare back or re-phase capital spending wherever possible, targeting to achieve a capex reduction of $1-$2 billion in 2015 across the group. In light of the recent position taken by OPEC and with oil prices where they are today, BP will clearly need to take a much more radical approach to its budget reductions.
However, given the scale of the company's operations and the fact that many of its mega-projects are well underway, a significant change to the previous operating plan is no easy task. The company intends to provide a revised guidance for 2015 in February. Significant changes could also be costly and disruptive to the business. As an example, BP expects to incur about $1 billion of non-operating restructuring charges over the next five quarters, including the current quarter, in connection from a business streamlining program that the company initiated some 18 months ago in response to resizing the group.
In Conclusion…
In the absence of a quick and decisive production cut by key OPEC members, the industry lacks a mechanism that would allow to adjust supply volumes to the level of demand. If such reduction is required, the price may need to travel down all the way to the level where operators begin to take volumes off the market and stay at those levels for several months to give the industry sufficient time to agree and implement necessary operational steps. The industry's sheer size and significant storage capacity define the relatively slow cyclical turnaround times.
In this regard, the deep decline in the price of oil that we are currently witnessing should by no means be interpreted as a fundamental change in the industry's productive capacity or cost structure (the two key components that could lead to a "paradigm shift" as it relates to the long-term price of oil).
0 comments:
Publicar un comentario