Gold Is Not In A Bear Market
Oct. 1, 2014 11:07 PM ET

Summary
- We are still in the second and longest stage of the gold bull market.
- Deflation everywhere, however, debt levels are rising everywhere.
- Central Banks around the world have given investors the illusion that all is well.
Just because gold has fallen in price from its highs the past 3 years doesn't mean that it's in a bear market. While you have read in many of my articles about the possibility of what a stronger dollar might do to gold I have also provided you with many of the indicators I follow so you can see the same things I see. But don't think for a moment any bearishness you may perceive I have has me negative on the future of gold. Don't believe for a moment that gold is in a bear market.
3 Phases of a Gold Bull Market
Richard Russell from Dow Theory Letters sums up best the 3 stages of a gold bull market (this quote was included in my book Buy Gold and Silver Safely).
First phase is where sophisticated investors, sensing a new bull market, make their initial commitment.
In the second phase, the public will start to buy gold, this in reaction to increasing political and social uncertainty, rising debt levels and nervousness as to the future of the dollar.
The third phase of the gold bull market will see a frantic rush by the public to buy gold. In this phase, gold will surge to undreamed of heights-a level beyond what anyone now envisions.
We are still in the second and longest stage of the gold bull market. It is during this stage where market makers will try and buck you off the gold bull. Just like with any stock, market makers will drive the price down and then drive the price up. They sometimes do this in quick moves on thinly-traded stocks and over a longer time frame with larger cap stocks. Many times it has nothing to do with valuation or news. It's simply how a market maker makes money.
Their goal is to squeeze an investor out of a position. If it is a market moving higher, then they will try and squeeze the shorts out of their position and get them to cover their shorts driving the price even higher still. All the while, they are shorting the stock as it forms the candlestick tail signifying a top is in place. Then they reverse the process and trap the longs who got into the game late by driving the price down. If you don't understand that market makers do this for a living, then you haven't traded stocks very long.
It is much easier for a market maker to move a stock that is thinly traded. If a stock has low volume, then you can see moves on a short-term basis that can knock someone out of their long or short position depending on which way the market makers wants to move the stock.
While market makers actions are only part of the movement of gold and silver, they are an important part that can't be discounted.
Silver Price Action
The Hunt Brothers in the late 70s took a thinly-traded silver market and cornered it by buying up all the physical silver they could while playing the futures market. The price of silver shot up to its all-time high of $50 an ounce and then proceeded to collapse after the Hunt brothers got into some trouble for their actions.
Seeing what a blow off top looks like with a chart using candlesticks, look no further than the 2011 price action in silver in the chart below. See the tail on the long candle stick shooting upwards? Then see the subsequent price action? What I am looking for is the opposite of this to signify the silver bottom. This doesn't mean it will come before I write my "all in" article, but it is definitely one thing I would love to see.
(click to enlarge)
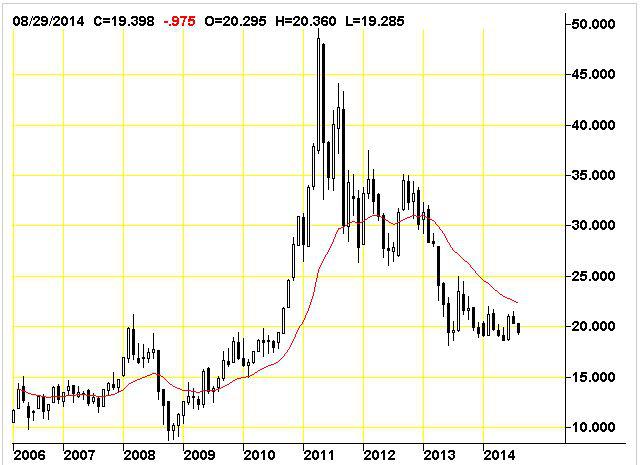 Silver Chart 2011 Top
Deflation Everywhere, However, Debt Levels are Rising Everywhere
The news out of Europe is showing the smell of deflation has taken over everywhere. According to the Wall Street Journal, article, the annual rate of inflation in the Eurozone has fallen to a five-year low. This has caused the dollar to move strongly up versus the Euro surpassing the 86 mark as you can see in the chart below.
UK housing fell for the first time in 16 months. Are things going to start imploding in the UK? Have you seen their debt to GDP ratio? How about that of Europe, Japan and the U.S.? Have any of these countries done anything to curb government spending?
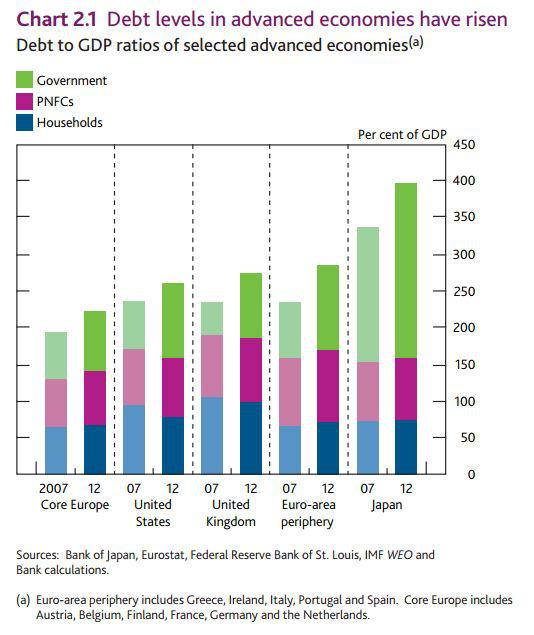
Debt Levels Major Countries
Emerging Market Debt Levels Rising
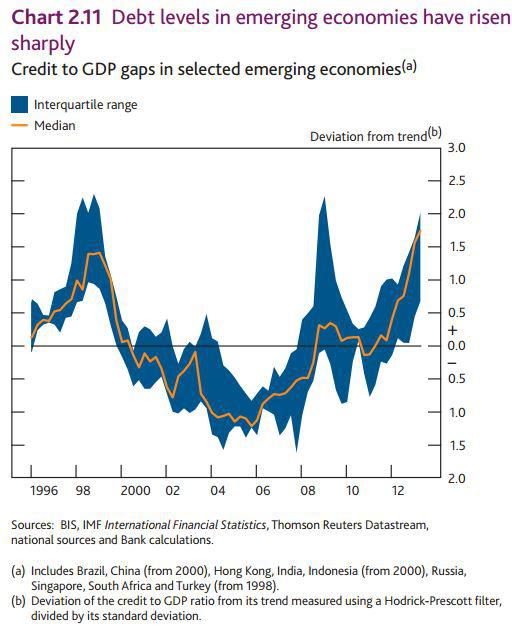
Debt Levels Emerging Economies
Is this debt situation all of these countries are facing sustainable or unsustainable?
Central Bank Illusions
What should be noted here is that Central Banks around the world have given investors the illusion that all is well with their countries' economies because they have a technology called a printing press that can make up for the fact that money velocity has come to a standstill while deflation wreaks havoc on their inflationary efforts. They are funding government and helping out the banks with the assumption that the economy will pick up steam.
This model has indeed worked for quite some time and many in the world have benefited from it. But it is governments who also abuse the system and the Central Banks are there to fund their madness. Both Congress and the Fed are at fault here in the U.S. and our national debt here that is fast approaching $18 trillion is indeed unsustainable once interest rates tick up.
What if the central banks are wrong about an economic upturn? What if the Fed tapered too much too early? Does anyone even think the Fed can do wrong? Can I remind you that the 2008 crisis was caused by the Fed artificially lowering interest rates (among other issues like subprime lending and the unregulated derivatives fiasco) and the Fed AFTER THE FACT with Congress had to put $9 trillion into the economy to save it? Do we forget so easily because the financial media has you believing the Fed, Greenspan, Bernanke and now Yellen are our heroes? Well, they are the banks' heroes, and some well-connected investment firms among others.
Below is your friendly reminder of what a mess the Fed got us into in 2008. How will they hold their credibility when the next crisis occurs? What are the odds of this occurring (see debt situation above)? What will the price of gold do?

2008 Crisis $9 Trillion Fed
Dollar Still King
While I have been dollar bullish for the short term, it doesn't mean that I am going to always be dollar bullish. As I have explained before, looking at the value of one currency priced in another is simply an illusion when all currencies buy you less and less over time. But perception at present is the U.S. Dollar is king while Europe and Japan go through their various issues. This is quite a two-day move for the dollar putting more pressure on gold and silver here in the U.S.
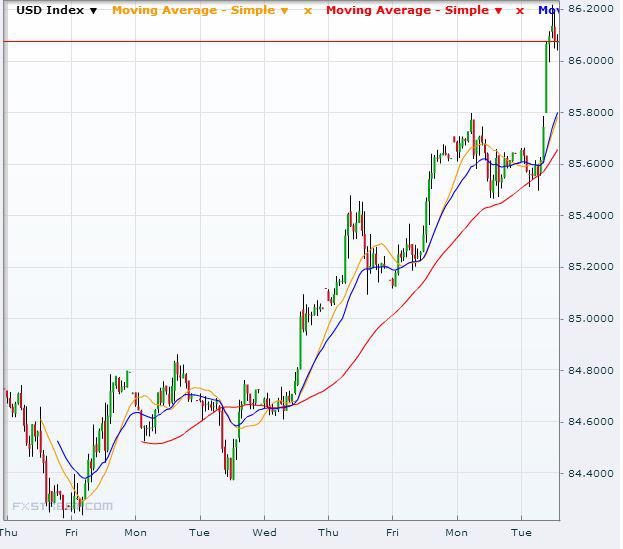
Dollar Index Over 86
The Gold Bull Market
In my last Current Thoughts on Gold and Silver section of my website I wrote the following about gold and silver.
Gold fell today after an early session higher but has not fallen below the closing low of $1,213.50 set a week ago. It still seems to me that it wants to break that 2013 low in the $1,190s. We simply aren't that far away from it and if we do break it, it could set up for a further decline in both gold and silver.We did break below last week's price and it seems the break of the 2013 low is on the table.
Keep in mind that this price is also resistance and we may get a short-term bounce. This would only be short lived as I am sticking with my call for a break of the lows. That's what market makers love to do. Make you scream. If you look at the historical chart for gold below the trend is still up. We are simply in the second and longest stage and you'll need a little patience for this stage to end and the third euphoria stage to begin. This might be just under $1,000 an ounce.
That's the number I am targeting. Not what gold bulls want to hear. And if I was a market maker I'd want to bring gold down below $850 an ounce. But I would make for an awful mean market maker. Even if we hit those levels I would still be as bullish as one can be. It's because I can do simple math.
(click to enlarge)
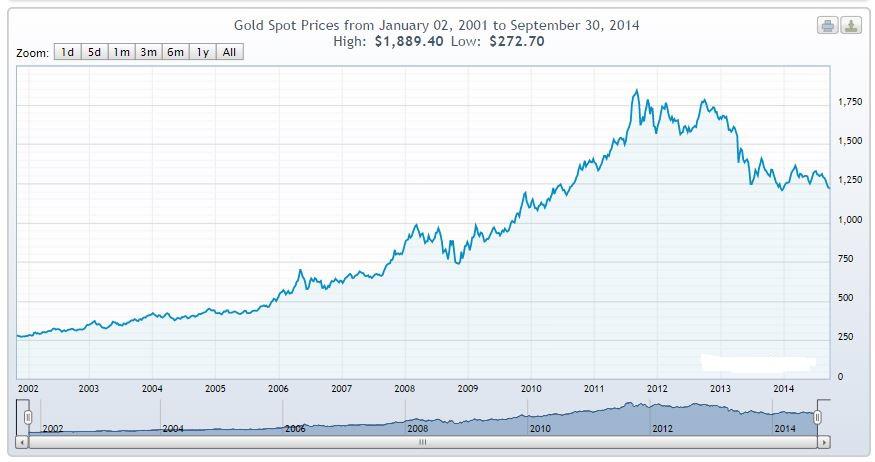 Gold Historical Chart
Current Advice on Buying Gold
My advice is still the same and that is to dollar cost average into the overall allocation you want to invest into precious metals. No one knows if I'll be right on the timing of my "all in" article, so I try and give you the best advice I can explaining what I see so you can time the markets the best that you can.
For those that are looking for a way to trade the markets from a micro to intermediate level I highly recommend following Avi Gilbert's team at ElliotWaveTrader.net.
I do believe it is better to own physical gold and silver and the good news is that unlike last year with the price drops, the premiums have not started to move higher yet with these price declines. For those that trade in and out of the gold markets or who don't mind the fees associated with an ETF and the fact you can't take physical possession of the metals (unless a large investor), then owning (NYSEARCA:GLD) or (NYSEARCA:SLV) might be an option.
Other ways to invest in gold and silver would be through Eric Sprott's gold and silver trusts (NYSEARCA:PHYS) and (NYSEARCA:PSLV).
0 comments:
Publicar un comentario