Is The U.S. Bankrupt?
Dec. 20, 2013 10:23 AM ET
by: Shareholders Unite
Others, like Peter Schiff, argue that the US is bankrupt and are so alarmed that they are against increasing the debt ceiling under any circumstance, forcing a retreat in government spending. Schiff actually ran for Senate to lead a filibuster, making sure the debt ceiling never got raised. He argues that doing so would force the government to cut spending down simply by depriving it of the funds.
However, the deficit is coming down quite rapidly, so we're concentrating mostly on the public debt, but let us first make the following point.
Structural deficits
A couple of years ago, the public sector deficit ran into the double digits (as a percentage of GDP), which is indeed unusually large. However, you must realize that to a great extent, this was simply a reflection of the state of the economy (in the midst of the biggest crisis in several generations).
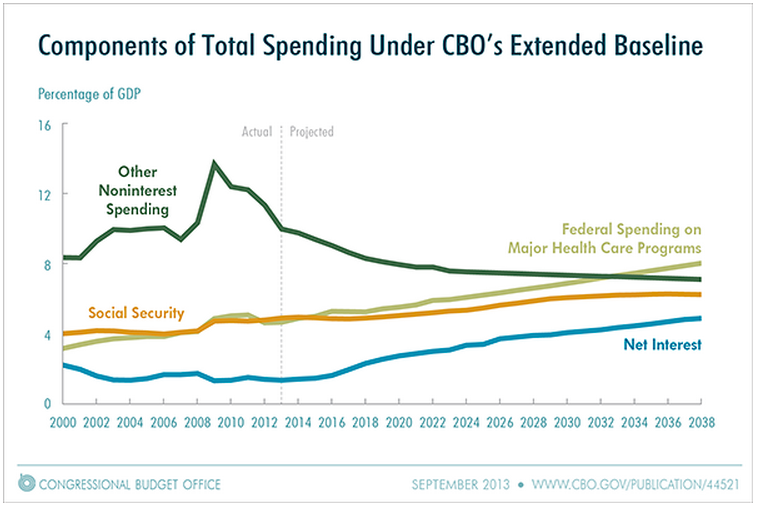
When the economy is in a recession, especially one as profound as the 2007-09 one, the deficit balloons all by itself, (you can see that in the graph below):
- Tax receipts collapse, as incomes, sales, and profits are all down
- Public outlays increase a lot as people get into trouble, losing jobs, houses, etc. So spending on unemployment, food stamps, housing assistance, etc. go up.
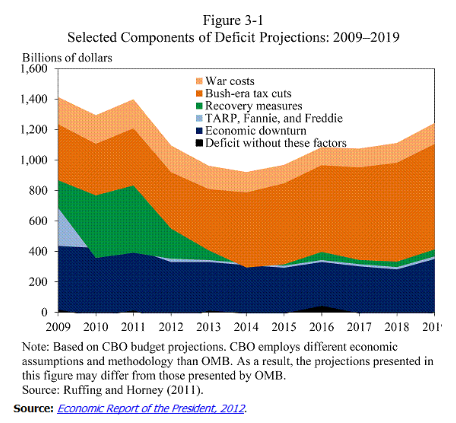
In order to factor these cyclical effects out, economists use a concept that's called the 'structural budget deficit'. This calculates the deficit factoring out these business cycle effects and assuming the economy performs more or less at full capacity. You don't even have to calculate anything, you can see how the deficit really fell at record pace in the last couple of years as the economy recovered:
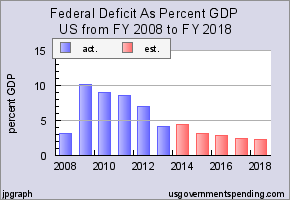
So there was a cyclical and a structural part of the deficit. The CBO (Congressional Budget Office) estimates that for 2013, the cyclical and structural parts were about equally big (at just over $420 billion). The former will decrease further when the economy returns to normal, it's the latter that is potentially a bigger problem.
One note of caution here, these traditional views might have to be reviewed in light of the 'secular stagnation' theory, which states that in the last couple of decades, the economy has only 'returned to normal' (that is, anything close to producing at full capacity) when in the grip of the frenzy caused by a credit infused asset bubble.
Sustainable deficit
A public sector deficit, even one net of interest payments (the so called primary deficit) doesn't necessarily lead to an ever increasing public sector debt. A growing economy with some inflation can actually sustain some primary deficit as long as the growth in GDP exceeds the (pre-tax) interest rate paid on the public debt (either both in nominal or in real values, it doesn't matter). This has been the case in the past 50 of the last 60 years.
For the deficit as a whole (primary plus interest payments), some simple calculations can be made, assuming long-term average nominal (real growth plus inflation) GDP growth of 5%, which is what the CBO assumes in its calculations. This results in:
Get the long-run average deficit down to 4%, and the debt-GDP ratio converges to 80%. Deficit of 3% of GDP, debt of 60% of GDP. [The Slack Wire]
The 4% deficit and 80% debt, that's roughly where we are today, so unless we have reasons to assume that either the deficit will increase and/or nominal GDP growth will fall below 5%, this situation is sustainable. People worried about the sustainability of public finances might also want to reflect on the following observation from the same source:
An implication of that last equation above is that if the total deficit averages zero over a long period, the debt-GDP ratio will also converge to zero. In other words, "Balance the budget over the business cycle" is another way of saying, "Pay off the whole federal debt."
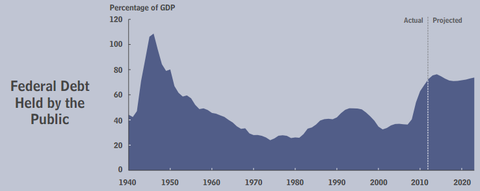
Public sector debt
However, the public sector debt is still increasing, at least in nominal ($) terms. We have already explained that this doesn't necessarily mean that the public debt is unsustainable
Indeed, $17+ trillion is a large number, and there is a potential of things getting worse should interest rates rise significantly. This would lead to raising interest payments, which would 'crowd out' other public spending, or make tax hikes necessary at some point.
Whilst $17+ trillion sounds very scary, there are several reasons to not be overly alarmed at this stage, we'll discuss these briefly.
Capacity to pay
Whilst $17+ trillion is certainly a very scary number, it really doesn't tell us what our debt burden actually is, whether we have the capacity to service that debt. In order to do that, you have to relate it to the productive capacity of the US economy, the GDP. A bigger GDP increases tax revenues and makes the public debt in relation to the GDP smaller, so the problem becomes less alarming.
For instance, if the public sector would incur debt in order to invest in (stuff that would enhance the productive capacity, like science, education, or some infrastructure), it would lead to a higher debt, but also higher future tax receipts and a higher GDP.
If the return on these investments exceeds the funding cost by some margin (necessary because the returns are further into the future), this would actually be favorable to the public debt position.
Equally, you read a lot of scary scenarios in which the Chinese (the biggest foreign holders, albeit with a mere $1.3 trillion) would dump US debt. Interest rates could rise as a result, but whether the net effect would be negative for the US isn't at all guaranteed, as the dollar will also fall, increasing US net exports and its capacity to service the debt.
You might also have noticed that a fall in the dollar isn't in the interest of the Chinese, who depend on overseas markets to sell a large part of their industrial output, so the initial question would be why the Chinese would actually sell all, or most of their US debt holdings.
Who owns the debt?
Sometimes, a picture tells more than a 1000 words, so here is a scheme of the major owners of US public debt:
(click to enlarge)
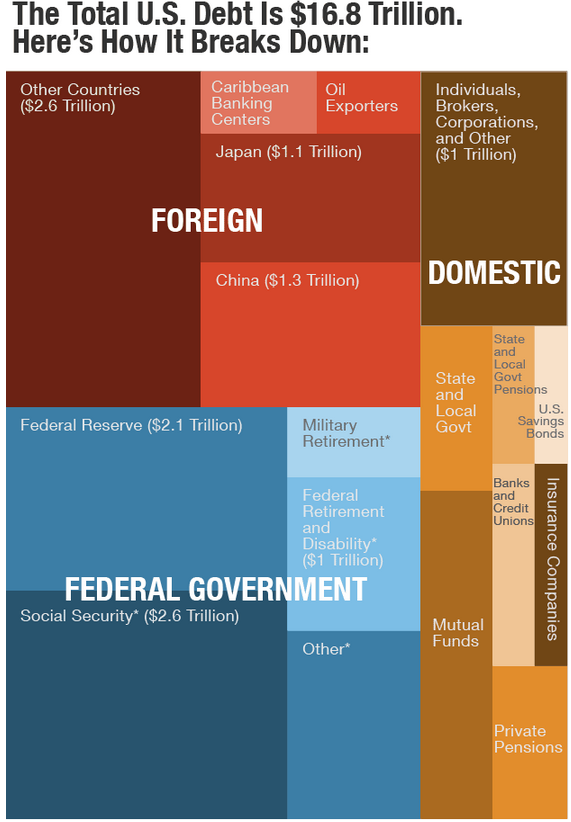
It is immediately obvious that:
- The Federal government owes at least $5.7 trillion to itself (including the Fed holdings)
- Only about $5 trillion is owed to foreigners
Now, you often hear that we pass on this debt to future generations, and that's true. But as it happens, we also pass most of the IOUs, the governments bonds to future generations, plus all the Federal assets, and in fact the whole productive capacity of the US economy. We state this as it cannot be assumed that efforts to reduce the debt will leave these positive items on the ledger unaffected.
Foreign assets and liabilities
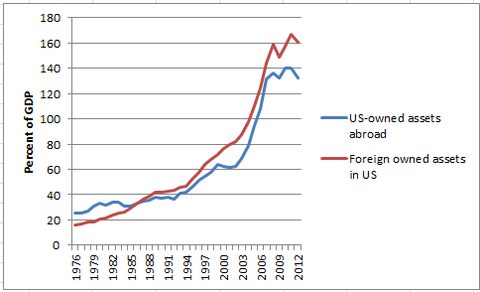
Whilst it is true that foreigners own a substantial part of public debt, or even total debt, for that matter, whilst not growing as fast as the liabilities, America also holds substantial claims on the rest of the world. Here is Krugman:
US liabilities consist largely though not entirely of bonds - yes, there are a lot of foreign-owned companies, but they're a much smaller factor - while US assets abroad consist mainly either of direct investments (companies we own) or stocks... Now, the point for the debt discussion is that the bonds we sell to foreigners count as part of the US debt number, but the assets we buy abroad don't count against it.
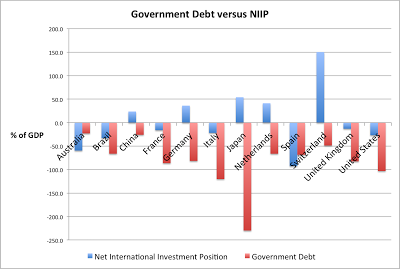
Here is another way of looking at it from Antonio Fatás. The graph below shows a country's public debt versus its NIIP, that is, its net international investment position. The NIIP is simply the difference between all foreign assets and all foreign liabilities. The NIIP for the US is only -25% of GDP. Note also that Japan, with its dramatic public sector debt in excess of 200% of GDP, still has more claims on the rest of the world than the rest of the world has on Japan.
Greece?
Now, public debt is really only in the low 70s as a percentage of GDP, hardly in Greek territory (150%+). But even if the debt would grow, would the US potentially get into trouble, with investors bailing, interest rates shooting up and the US having to ask for a bailout?
The latter is very unlikely anyway, as there are no countries or institutions big enough to finance a US bailout. Perhaps only the rest of the world combined would suffice, but we're not going to speculate on that because it's unlikely that it would come to that. Why not? Well, unlike Greece, the US has an absolutely crucial advantage, its public debt is denominated it in its own currency.
Basically, it's extremely difficult for the US to go bankrupt, because it can always meet its debt obligations. Investors lost faith in Greek debt mostly because it's not denominated in its own currency, but in euros. Greece could not rely on the ECB, the issuer of these euros, to issue enough of these to guarantee Greek debt holders that they would get their money back. In fact, quite the contrary, the ECB for long refused to give such 'lender of last resort' guarantees.
Only recently has the ECB given such guarantees, reluctantly, and conditionally, and as we predicted, this guarantee alone was enough to calm the bond markets of the eurozone periphery, despite the fact that public debt/GDP ratios have escalated upwards ever since. The latter is a clear sign that the markets care more about a lender of last resort than the actual debt burden.
There is another subtle advantage for a country issuing debt in its own currency. If a holder of the country's debt sells his position, he will also sell the currency.
This has a few secondary effects:
- The currency will tend to fall, improving the competitiveness of the country, and hence its capacity to service its debt (tax receipts and GDP will rise)
- The buyer of the currency will ultimately put this in the country's assets, so the money doesn't actually leave the country.
History
The above points about Greece receive further credence if we look back at history. You'd be hard pressed to find an example of a country experiencing any kind of Greek crisis if it's the master of its own currency, that is, if it has the implicit 'lender of last resort' guarantee of its central bank and the other two advantages we just described.
Paul Krugman has looked at this, and he could come up with just a single example, France in the 1920s. France emerged from WWI with debt levels well above 200% of GDP (230%+ in 1921 and 1922), but these debt levels fell to 140% by the end of the decade, mostly through a currency devaluation setting of inflation.
But these policies didn't really affect growth. The French economy kept on growing significantly, apart from 1926 when the Poincaré government embarked on fiscal austerity and a return to the gold standard.
He also showed that interest rates and the level of public debt weren't at all correlated for over 200 years of UK history, even when the British public debt escalated to unprecedented levels (after the Napoleonic wars, or WWII), interest rates were relatively benign.
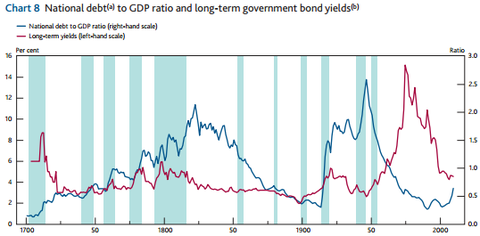
In that same graph, you also see how countries recover from even very high public debt level, the combination of economic growth, mild inflation, and time does wonders, slowly melting away the outstanding debt levels to manageable proportions.
Demographics
Whilst there is some alarm in the US about retiring baby-boomers, compared with other developed economies, the US demographical development can only be considered benign. Many developed economies already suffer from shrinking population, first and foremost the country with the highest public debt by far, Japan.
Compare for instance the figures for the US with the Japanese:
- Percentage of population under 18: US: 23.5%. Japan under 15 population is expected to shrink from the current 14.6% level (2000) to the 14% mark in 2005, and eventually down to 12.0% in 2021 (see Table 1, Figure 4). The downward trend continues to 11.0% in 2036, and by 2050, the percentage is expected to be around 10.8%.
- Percentage of population over 65: US: 13.7%; Japan 24.8%
- Projected population: 2025: US: 351.4M; Japan: 119.8M
- Projected population 2050: US: 422.6M (1.3x2012); Japan 95.5M (0.7x2012)
Even if demographical developments are more favorable (and in many cases much more so) compared to many other developed countries, US population will also grow older and the dependency rate (the number of working people having to support the number of older people) will rise. Is this a problem? At first sight, yes, until you realize that:
the fact that workers are becoming more productive year by year means that it will take fewer workers to support each retiree. The United States had 10.5 farm workers for every hundred people in 1929; it has fewer than 1.1 farm workers for every hundred people today. Yet the population is well fed, and we even export food. Rising farm productivity made this possible. Similarly, increases in worker productivity (which have been and should be reflected in higher incomes), however small compared with those of the past, will allow each retiree to be supported by an ever smaller number of workers. [The Atlantic]
Tax base
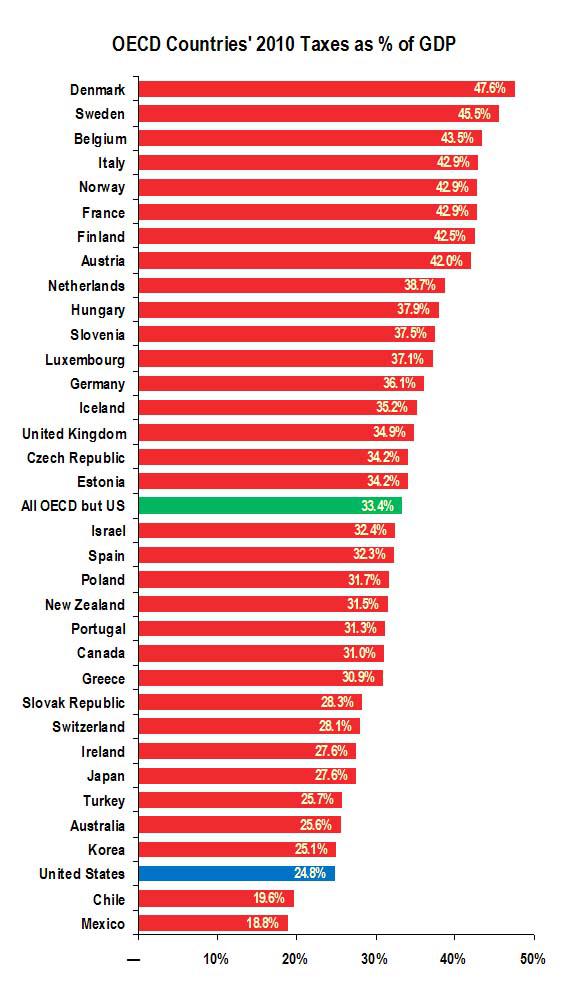
The Federal government actually collects a rather modest part (roughly 15-16%) in taxes as a percentage of GDP. Now, we know if you add state and local taxes, this could be 10% higher, but this is still very much at the low end of the tax burden scale:
The U.S. was the third least taxed country in the Organization for Economic Cooperation and Development (OECD) in 2010, the most recent year for which OECD has complete data. [CTJ](click to enlarge)
Discretionary spending
The debate concentrates on mandatory spending (entitlements), those parts of public spending which are mandatory. Discretionary spending has to be budgeted and approved every year. The biggest category is military spending (roughly half of discretionary spending).
(click to enlarge)
Since there aren't really many people that argue discretionary spending is at an unsustainable level, or threatens to spiral out of control. In fact, one could argue the opposite (see the figure above), and since indeed significant cutbacks have already been made, we will not dwell on these for the (already lost) sake of brevity.
Entitlements
There are three big chunks of entitlements, social security (mainly pensions), Medicare (healthcare for the over 65) and Medicaid (emergency healthcare for the uninsured). These are mandatory spending programs but the funding is a little different
- Social security is not funded by the Federal budget it has its own tax funding, mostly the payroll tax. Current year's expenditures are paid out of the social security taxes, any excess goes into the Social Security Trust Funds, which invests in government bonds. The funds stood at $2.2 trillion. Any shortage in funding only has meaning within this context
- Medicare; healthcare for the elderly
- Medicaid and Foodstamps
And there are some social insurance programs (mainly unemployment benefits). The biggest three together (social security, Medicare and Medicaid) do not even make up 10% of GDP.
Now, here is the latest state of the Social Security Trust Fund:
After 2020, Treasury will redeem trust fund asset reserves to the extent that program cost exceeds tax revenue and interest earnings until depletion of total trust fund reserves in 2033, the same year projected in last year's Trustees Report. Thereafter, tax income would be sufficient to pay about three-quarters of scheduled benefits through 2087.
Of course these are projections, but this doesn't sound like any imminent crisis. You might also want to entertain the thought that one of the reasons people are worried about the long-term sustainability of public finances is the possibility of rising interest rates, but if that happens, the interest earnings from the social security trust funds would slowly rise.
And while we're at it, let's keep things in perspective:
Program cost equaled 4.2 percent of GDP in 2007, the last pre-recession year, and the Trustees project that cost will increase to 6.2 percent of GDP for 2036, then decline to about 6.0 percent of GDP by 2050, and thereafter rise slowly reaching 6.2 percent by 2087. [Social Security Trust Funds Summary]
So the projected shortfall (from 2033 onwards) is just 25% of that, or 1.5% of GDP. That's serious, but it's a long way off of blowing the lid of public finances. It might also be noticed that the obvious remedies in 2033 when the funds have ran out will be to either raise payroll taxes and/or earmark a bigger percentage of these to social security and/or reduce pensions.
But these are essentially the same options we have today, so why we would be forced doing today what we can do in 20 years time isn't immediately obvious. A problem is that politicians (both at the Federal, and at the state and local levels) do not always treat pensions with the respect they deserve.
And social security is hardly generous, even it isn't means tested. The average Social Security benefit is less than $15,000 a year [Robert Reich]. Median income of Americans over 65 is less than $20,000 a year. The main underlying problem of rising social security is rising healthcare cost.
Medicare
The projections for Medicaid are a little more worrisome, again from the same report:
The projected date of HI Trust Fund depletion is 2026, two years later than projected in last year's report, at which time dedicated revenues would be sufficient to pay 87 percent of HI cost.
But once again we have to put this into perspective:
the aging population and rising health care costs cause SMI projected costs to grow steadily from 2.0 percent of GDP in 2012 to approximately 3.3 percent of GDP in 2035, and then more slowly to 4.0 percent of GDP by 2087.
So the shortfall from 2026 onwards is 13% of 3% or just one third of a percent of GDP. This is basically a rounding error, hardly cause for alarm. What you also very much should realize is that the assessment is quite sensitive to cost assumptions:
Under the low - cost assumptions, trust fund assets would start to increase in 2014 and continue to increase throughout the projection period if the provisions of current law were to continue unchanged. Under the high - cost assumptions, however, asset depletion would occur in 2019. [Medicare 2013 report]
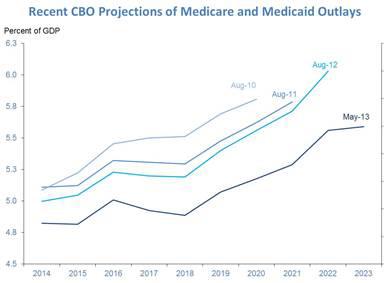
The last couple of years seem to have brought quite a bit of good news on the healthcare cost front, see below.
Means tested and social insurance programs
There are some means tested programs, such as Medicaid and food stamps, but these are really not very big (2.5% and 0.5% of GDP). Social insurance is mainly unemployment compensation. While that was larger in the aftermath of the financial crisis, it should return to its long-term share of GDP, which is well under 1%.
Not any of these programs are likely to break the back of public finances.
General observations on entitlements
Some argue that there could be significant gains if we would privatize much of these programs. However, according to Professor Lindert from the New America Foundation there are huge efficiencies in providing pensions and healthcare publicly rather than privately:
A main reason is that in a properly run welfare state, benefits are nearly universal, which eliminates vast amounts of administrative overhead necessary to decide who is entitled to benefits and who isn't, as is the case in America, and eliminates the disincentives to work resulting from benefit phase-outs. A 2003 study in the New England Journal of Medicine found that Canada's single-payer health system had less than a third of the per-capita administrative cost of the United States system, with its many private insurance companies and overlapping government programs - $307 per year in Canada versus $1,059 in the United States. [Barlett]
Indeed, here is another observation from Laura D'Andrea Tyson:
Despite competition and choice in the private insurance system, Medicare spending has grown more slowly than private insurance premiums for comparable coverage for more than 30 years.
You might also want to consider the following two conclusions from the CBPP:
Congressional Budget Office (CBO) projections show that federal spending on low-income programs other than health care has already started to decline and will fall substantially as a percent of gross domestic product (GDP) as the economy recovers. By the end of the decade, it will fall below its average level as a percent of GDP over the prior 40 years, from 1972 to 2011. See Figure 1.) Since these programs are not rising as a percent of GDP, they do not contribute to our long-term fiscal problems.
These two factors - the growth of health care costs and the aging of the population - explain all of the long-term growth of program expenditures as a percent of GDP [CBPP]
Healthcare cost
By far the biggest risk of program escalations in entitlement spending comes from rises in medical cost. To a considerable degree, these are unavoidable:
- Productivity increases are much more difficult in healthcare compared to industry, although that elusive holy grail of healthcare, the electronic patient file, could really decrease cost considerably.
- People live longer, and old age is often accompanied by health problems
- New treatments are devised with considerable regularity
However, compared to all other advanced nations, the US has markedly higher healthcare spending, almost 20% of GDP. No other country comes close. However, Medicare and Medicaid together count for less than 5%, they are not the main problem here.
In all the media hoopla about Obamacare, it isn't widely appreciated that there has been some significant development on this front
Here is Sarah Kliff from the Washington Post wonkblog:
All told, health care costs have been growing more slowly over the last three years than any other time period since 1965. More recently, yearly health cost growth slowed from an average rate of 3.9 percent between 2000 and 2007 to 1.3 percent between 2011 and 2013.
While part of that is probably cyclical (due to the recession), there are reasons to think that there is something of a structural shift downwards in cost occurring, for instance as a result of penalties for readmissions (which not only reduces cost, but also increases quality of healthcare).
The latter is part of the ACA, Obama's signature healthcare law that got off to a rather rocky start, but evidence is now gathering that ACA is at least partly responsible for the unexpected slowdown in healthcare cost increases. The consequences can be rather significant. Here is Peter Orzag, former director of the CBO, now at Citybank:
If Medicare costs continue to grow at the same rate per beneficiary as the average of the past five years, "there's no increase in Medicare as a share of GDP despite the coming retirement of Baby Boomers, the entire long-term fiscal gap in that program disappears and therefore most of the long-term fiscal gap facing the nation disappears.
He added that rather than to bicker over small potatoes in present day budget battles, politicians should exert maximum effort to reinforce this bend in the healthcare cost curves. We couldn't agree more. Given America's much higher healthcare spending, compared to other developed countries, here is where much of any future public finance problems can be solved.
Conclusions
- The public debt situation isn't nearly as scary as the $17 trillion headline figures might suggest, a significant part is owed to other Federal agencies, and future generations will inherit not only the debt, but also most of the government bonds
- Deficits were mostly cyclical and have come down rapidly to the 4% level where they produce a stable 80% debt/GDP level under historical 5% nominal GDP conditions
- The US has (compared to most other developed countries) rather favorable demographics, a relatively modest welfare state and one of the lowest tax bases
- The US can print its own money, which is the world's reserve currency and it has very deep financial markets. There isn't really a relevant example of a country facing dramatic consequences as a result of foreign investors bailing under comparable circumstances
- Entitlements are on a mildly upward trajectory (depending on assumptions) as a result of an aging population and an increase in healthcare cost, but the latter especially contains much low hanging fruit (although mostly in the private sector part) and a promising start of bending these cost curves is already well underway. But entitlements seem too small to cause any real problems for the sustainability of public finances for some time to come.
So, yes, US public debt is relatively large, but we think that there is relatively little reason for immediate worry. Efforts should be concentrated on bending the healthcare cost curves further, these give by far the biggest bang for the buck.
0 comments:
Publicar un comentario