Gold Rally- Already Over?
Nov 3 2013, 05:18

Even though the conclusion of the October FOMC Meeting was dovish as the Fed decided to maintain the pace of its $85 billion monthly bond-buying program, the precious complex was under pressure due to profit-taking. Gold (GLD) declined by 1.40%, while silver (SLV) fell by 3.41% Friday.
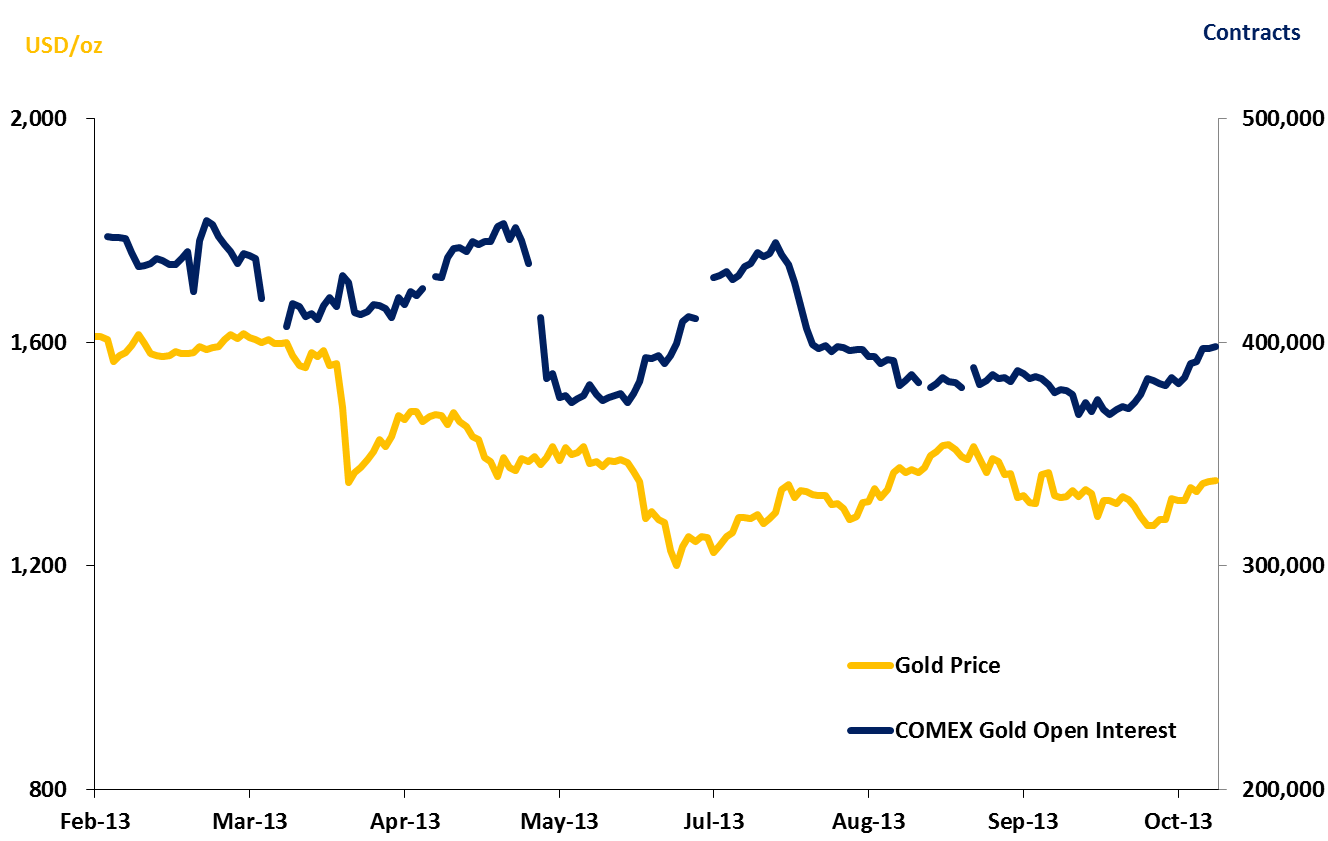
Chart 1: COMEX Gold Open Interest
Source: Bloomberg
As seen in Chart 1, the COMEX Gold open interest has been increasing by roughly 4% since October 15. As gold prices have risen during the same period, it is likely that new long positions haven't been added, which means that market participants have been positioned on the long side ahead of the FOMC Meeting on October 29-30. Because the FOMC statement was widely anticipated and there was nothing new from the meeting, market participants decided to liquidate some of their long positions to take some profits.
The sustainability of the recently developed uptrend comes now into question as ETF redemptions continue and the physical side remains soft and.
Gold ETF redemptions
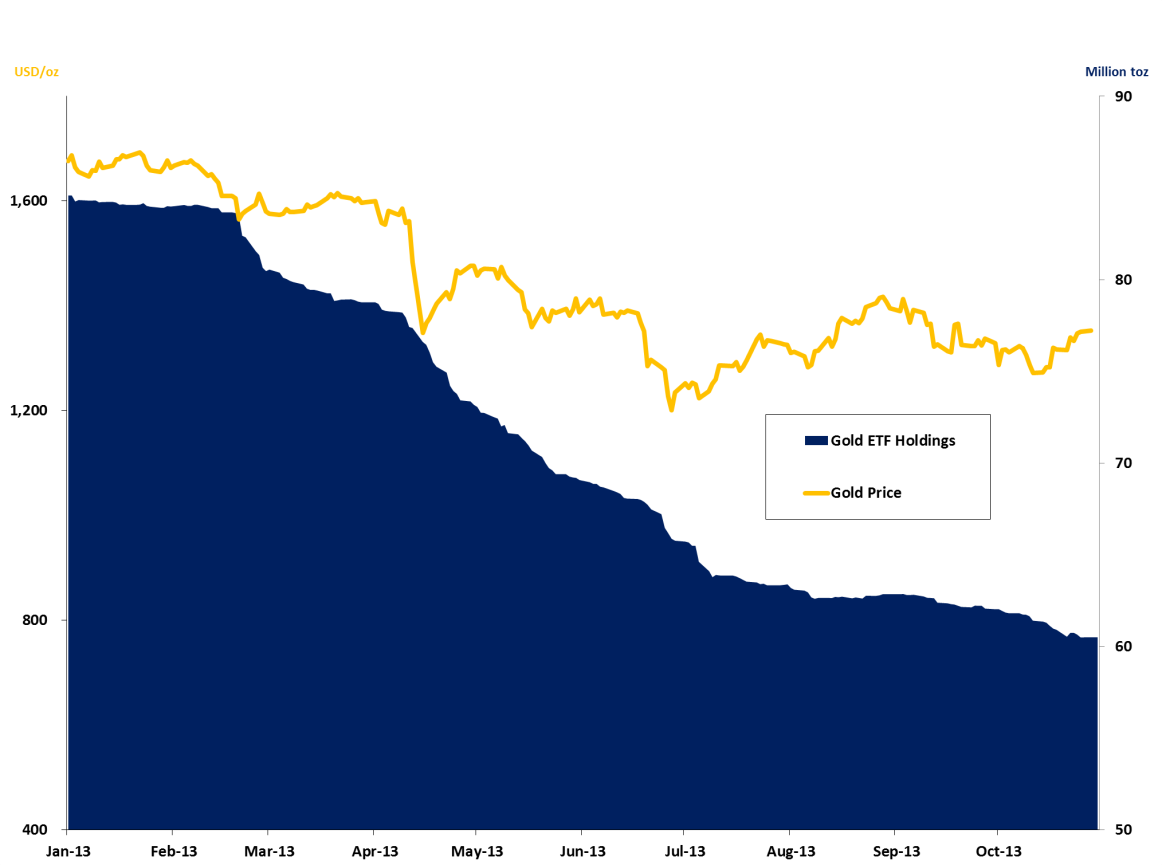
As shown in Chart 2, substantial gold ETF outflows have been seen since the beginning of 2013. Current gold ETF holdings (PHYS) have fallen by 24 million to 60.5 million troy ounces from 84.5 million troy ounces in January 2013. As long as ETF outflows do not stabilize, the yellow metal will have difficulty maintaining upside momentum.
Chart 2: Gold ETF Holdings
Source: Bloomberg
Physical demand out of Asia
India
As of October 30, 2013, gold premium in India has fallen from $120 an ounce to $60-70 an ounce mainly due to weak demand. According to Suresh Hundiya, a Mumbai based bullion trader, "Due to weak demand for gold on the domestic market premiums have fallen to $60 -70 per ounce. Gold jewelry demand is very low at the moment due to which prices also corrected on the Mumbai spot market".
China
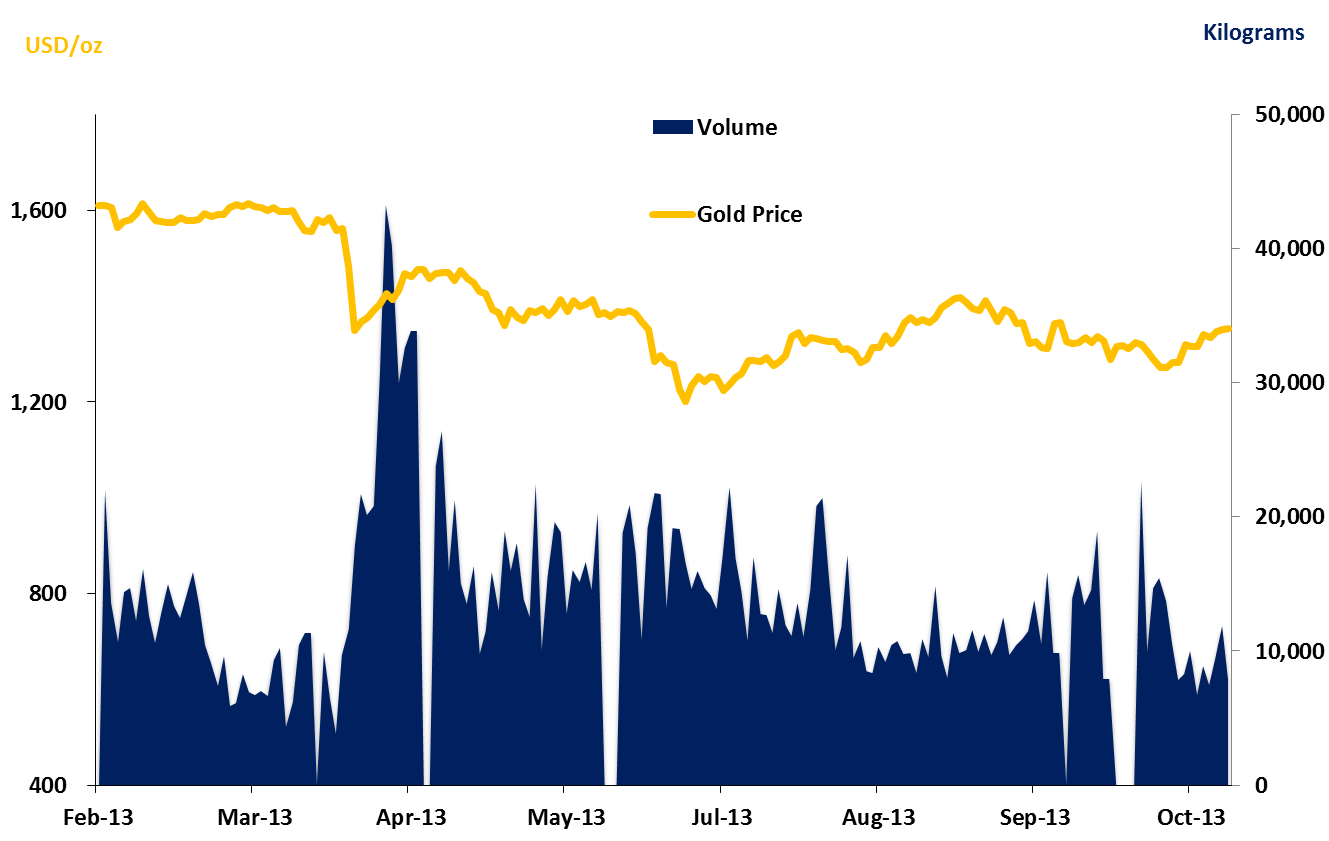
Chart 3: Volumes on the Shanghai Gold Exchange
Source: Bloomberg
As seen in Chart 3, volumes hit a record 43,272 kilograms on April 22, 2013 as Chinese investors rushed into the gold market earlier this year amid bargain hunting when prices were falling. Let's examine why volumes have been decreasing since April.
First, because gold entered into a prolonged bear market, sentiment has been hurt and Chinese investors stopped frenzy buying.
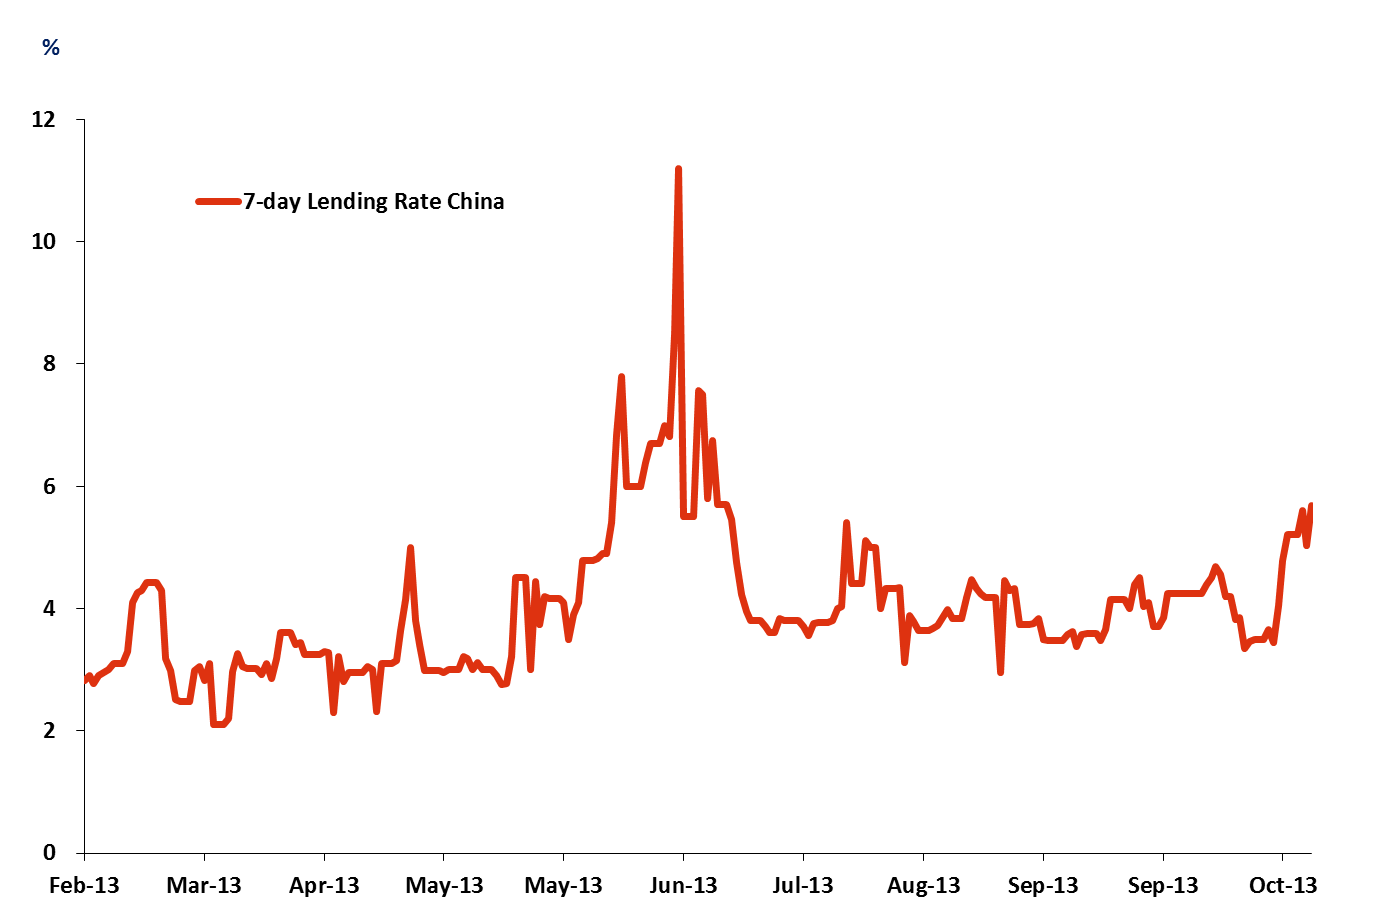
Chart 4: 7-day Lending Rate in China
Source: Bloomberg
Second, because we are seeing speculation that China's central bank will tighten monetary policy as inflation fears are growing. Indeed, a report showed that house prices in China jumped the most in nearly three years with double-digit gains in major cities. This is already being reflected in the rising 7-day lending rate, reaching its highest level in a few months. It is likely that Chinese are reducing their gold holdings to generate liquidity.
In sum, even though gold has witnessed a mini-rally since mid-October, gold ETFs' outflows need to stabilized and physical demand out of Asia needs to pick up in order to find any upside momentum in the short term.
0 comments:
Publicar un comentario