The Mother Of All Bubbles?
Sep 20 2013, 09:48
Unprecedented Risk as the World's Debtberg Grows
And yet, one has to ask oneself, what does it really mean when the mere threat of a tiny reduction in central bank liquidity provision is all it takes to upset markets around the world and the removal of that threat is seen as a sign that there are no risks at all?
As the recent quarterly review of banking and financial market developments published by the BIS shows, the world is drowning in more debt than ever. Since the crisis of 2008, the global answer to the problems caused by too much unproductive debt was to simply vastly increase the amount of unproductive debt in the system.
At the same time, central banks have massively goosed the money supply everywhere. This serves mainly to bail out the insolvent fractionally reserved banks at everybody else's cost. Not only do savers and all those dependent on fixed income no longer get a fair return, but the quality of the money issued by the central banks declines as its quantity increases. We may not yet have become fully aware of the effects, but they are beginning to show up, even if official measures of 'inflation' serve to hide most of them. Of course the distortion in relative prices in the economy is all too visible as the prices of titles to capital and certain commodities soar, but very few observers care about that.
As the charts below show, investors have been lured into taking massive risks while at the same time eschewing the instruments that could afford them a measure of protection (of course, system-wide risk cannot be eliminated that way: it can only be shifted around).
Update of Selected Credit Market Charts

We should perhaps call this the "nothing bad can possibly happen" update, because that is the message from the markets. Not only is money continuing to flow in big gobs into risk assets, market participants also no longer see any risk associated with them. What we have here is the "Ben helicopter effect" in all its glory.
As the recent quarterly review of banking and financial market developments published by the BIS shows, the world is drowning in more debt than ever. Since the crisis of 2008, the global answer to the problems caused by too much unproductive debt was to simply vastly increase the amount of unproductive debt in the system.
At the same time, central banks have massively goosed the money supply everywhere. This serves mainly to bail out the insolvent fractionally reserved banks at everybody else's cost. Not only do savers and all those dependent on fixed income no longer get a fair return, but the quality of the money issued by the central banks declines as its quantity increases. We may not yet have become fully aware of the effects, but they are beginning to show up, even if official measures of 'inflation' serve to hide most of them. Of course the distortion in relative prices in the economy is all too visible as the prices of titles to capital and certain commodities soar, but very few observers care about that.
As the charts below show, investors have been lured into taking massive risks while at the same time eschewing the instruments that could afford them a measure of protection (of course, system-wide risk cannot be eliminated that way: it can only be shifted around).
Given that central banks are adamant that they will keep interest rates at zero for as far as the eye can see, there are two possibilities as to how this could play out.
Either we are now on the cusp of the mother of all bubbles, a bubble in risk assets that dwarfs anything that has happened before (in fact, by some measures we have already attained that exalted state of affairs – consider e.g. that junk bond yields have reached all time lows in the course of this year), or the bubble that is already under way will sooner rather than later run into troubles that are independent from central bank interest rate policy.
What possibilities are there? There are in fact quite a few. Interest rates and/or inflation expectations might 'get away' from the central bankers. Economic performance may unexpectedly weaken in spite of 'ZIRP'.
Moreover, a number of 'risk sand piles' is in perpetual danger of having a grain of sand too many piled atop them. Think of Japan's massive fiscal debt or the still growing debtberg in Europe.
Since the current echo bubble is in several ways different from the traditional credit expansion driven booms in which the commercial banks are the main drivers of credit growth, it stands to reason that its demise may not follow the traditional pattern either (this pattern is usually that the central bank raises rates until something breaks). We will have to wait and see what transpires, but our guess is that some 'left of field' financial accident is likely to become the trigger.
On to the charts.
Update of Selected Credit Market Charts
Below is our customary update of credit market charts: CDS on various sovereign debtors, banks and commodity producers, bond yields, euro basis swaps and a few other charts. Charts and price scales are color coded (readers should keep the different price scales in mind when assessing 4-in-1 charts). Where necessary we have provided a legend for the color coding below the charts. Prices are as of Friday's close.
.

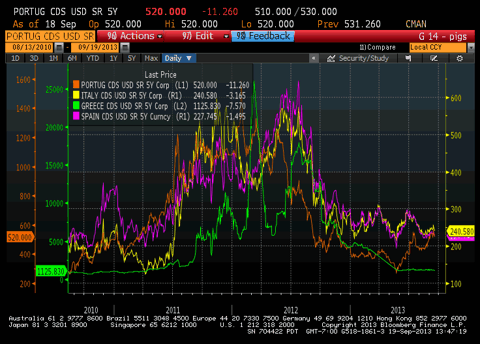
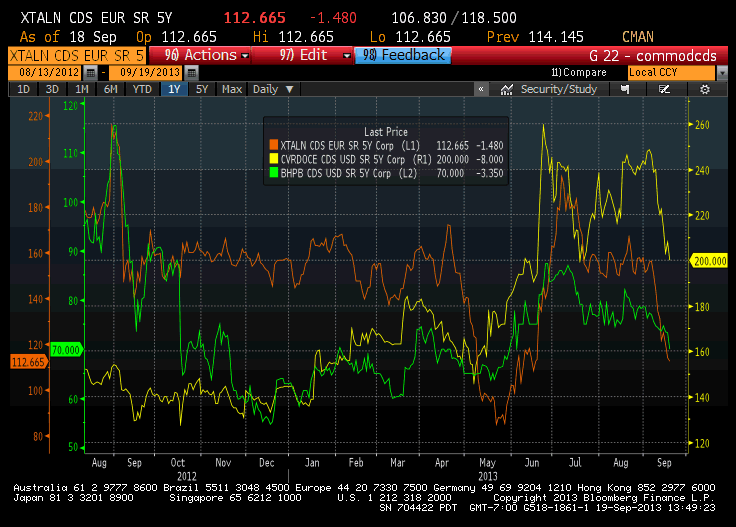
5-year CDS on Portugal, Italy, Greece and Spain, long term. Currently at the levels last seen in early 2011. Portugal is the lone standout, as it has seen a big rise in its CDS spread.
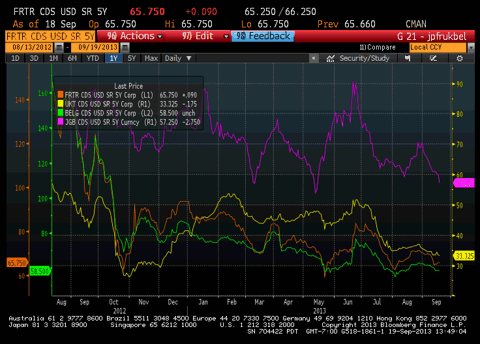
5 year CDS on France, Belgium, the UK and Japan. Punters evidently see little risk in Japan's 1 quadrillion yen public debt mountain. Why, the BoJ is buying up most of the new issuance anyway! Nothing can go wrong! Belgium, a major fiscal offender in the euro area last year, barely elicits a yawn.
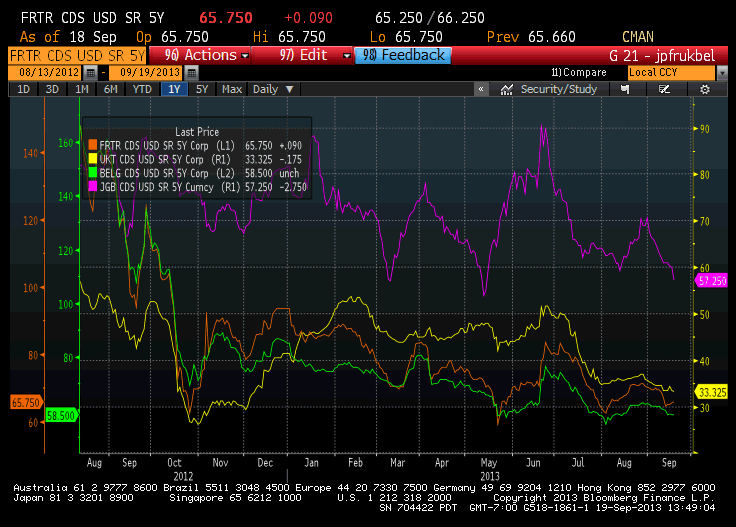
5 year CDS on France, Belgium, the UK and Japan. Punters evidently see little risk in Japan's 1 quadrillion yen public debt mountain. Why, the BoJ is buying up most of the new issuance anyway! Nothing can go wrong! Belgium, a major fiscal offender in the euro area last year, barely elicits a yawn.
.
.
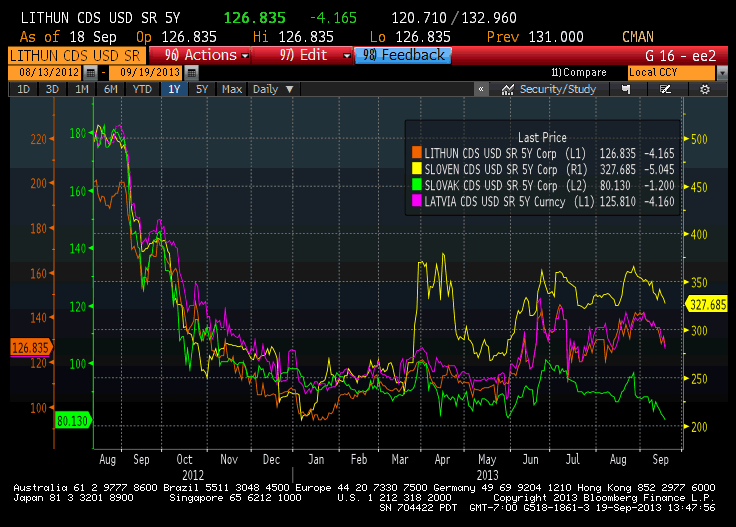
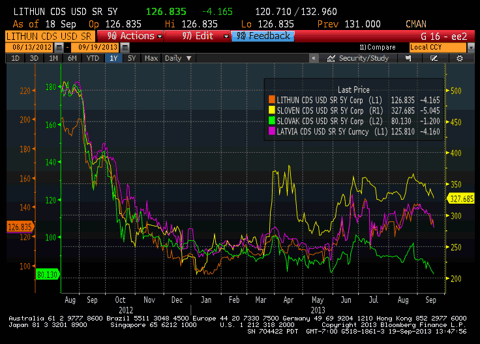
5-year CDS on Latvia, Lithuania, Slovenia and Slovakia – not even Slovenia can exercise the market's imagination anymore.
.
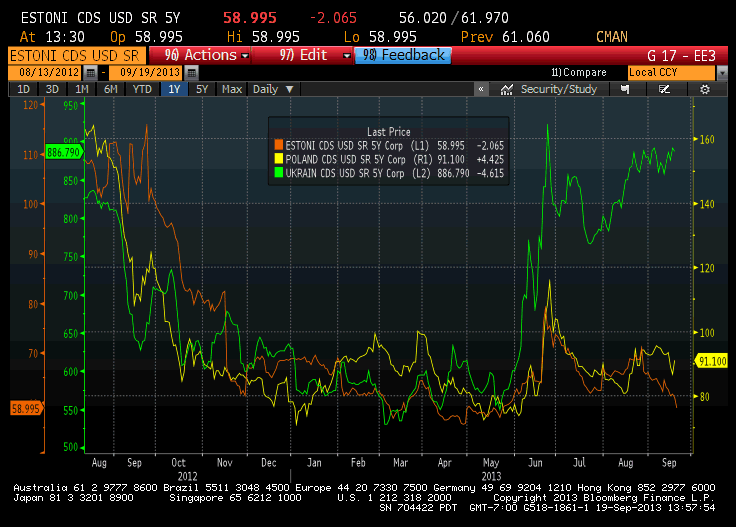
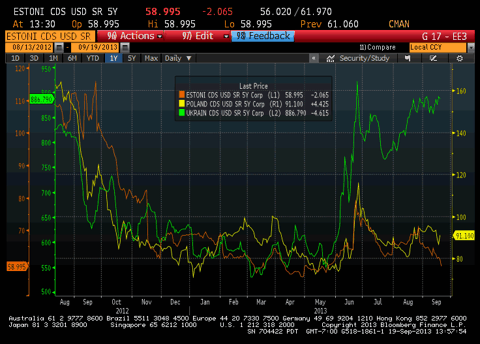
5-year CDS on Poland, Estonia and the Ukraine. The Ukraine is one of the few exceptions and continues to be seen as a major default risk.
.
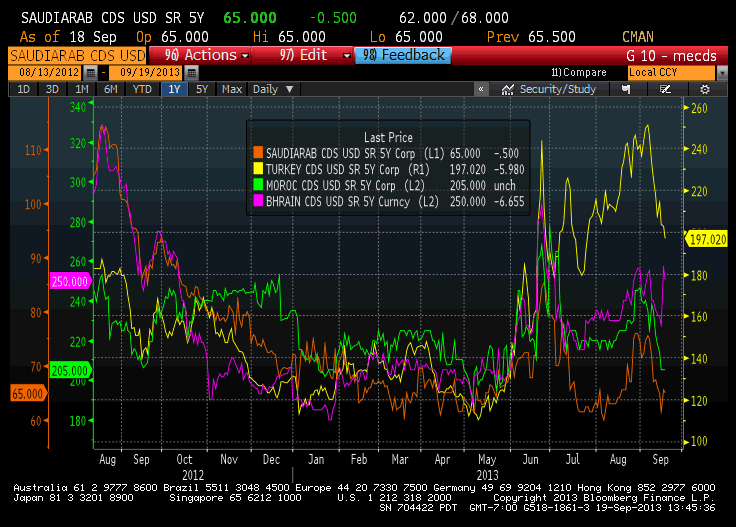
5-year CDS on Morocco, Turkey, Saudi Arabia and Bahrain. Civil war in Syria? No problem. Turkey's recent convulsions have also been relegated to the memory hole.
.
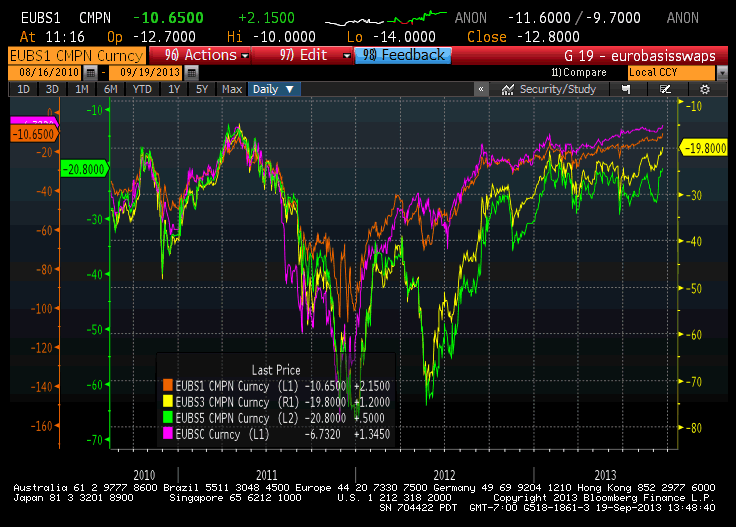
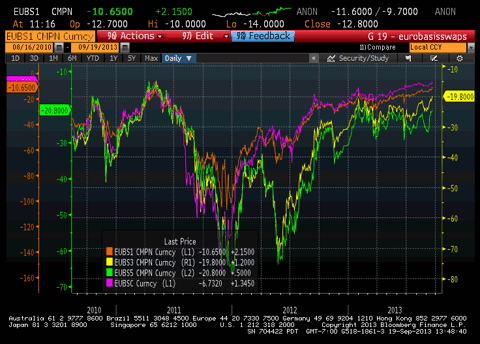
Three-month, one-year, three-year and five-year euro basis swaps – back on the recovery trail. We wouldn't have thought it possible, but they have really managed to convince people of the euro's viability.
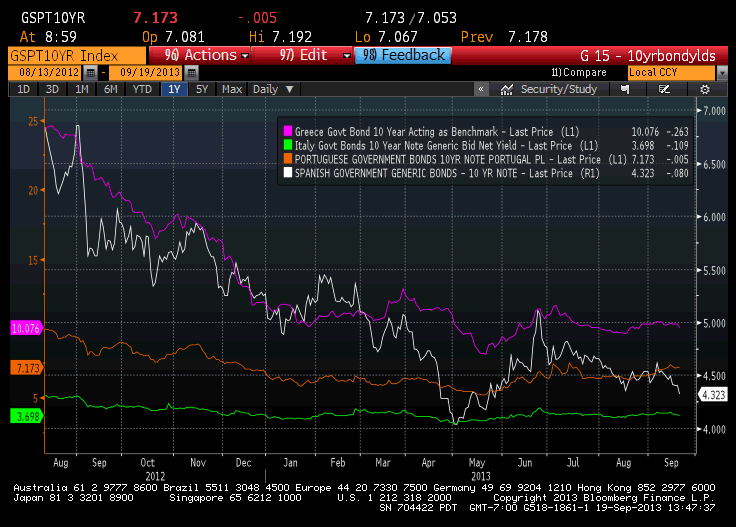
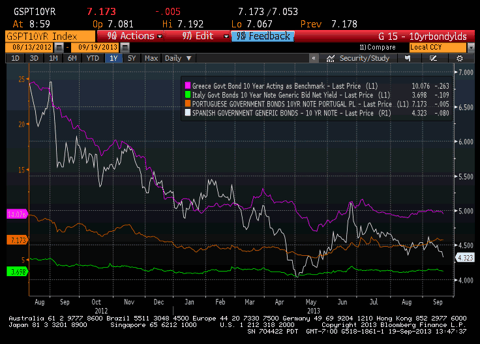
10-year government bond yields of Italy (bid price, generic gross yield is at 4.35%), Greece, Portugal and Spain .
.
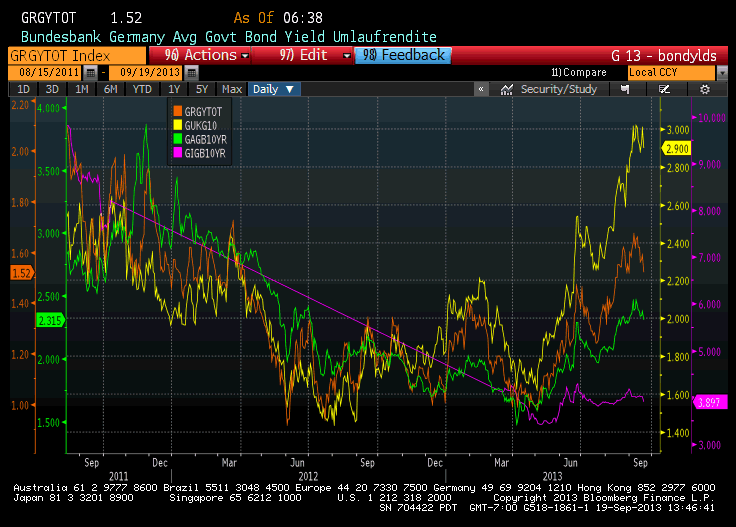
Austria's 10-year yield (green), U.K. gilts yield (yellow), Ireland's 10-year yield (cyan) and Germany's 10-year Bund yield. 'Safe heavens' are out, but even they are seeing some buying in the wake of the FOMC announcement. No doubt Carney's BoE is set to follow suit with fresh inflationary measures as well. After all, a gilt yield of 2.9% 'may endanger the recovery'. Rrrrright !!!

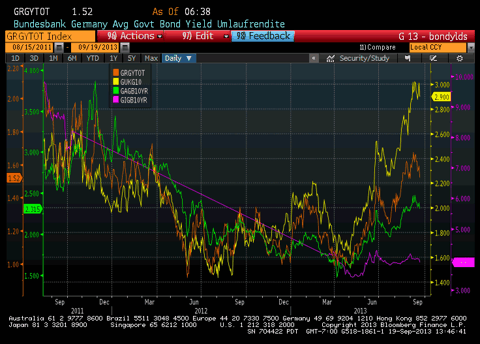
China's repo rate (orange) and government bond yields (3, 5 , 7 and 10 years)
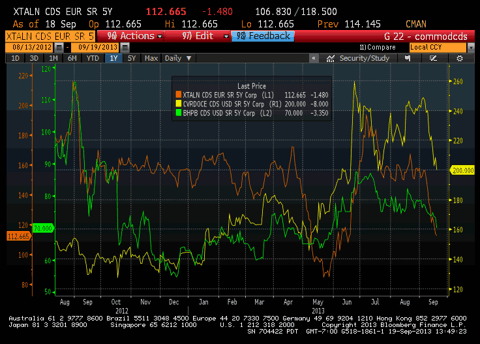
5-year CDS on the senior debt of three major commodity producers: Vale (yellow), Xstrata (orange) and BHP Billiton (green). Jim Chanos better look out, the market seems to think iron ore producers are perfectly 'safe' again.
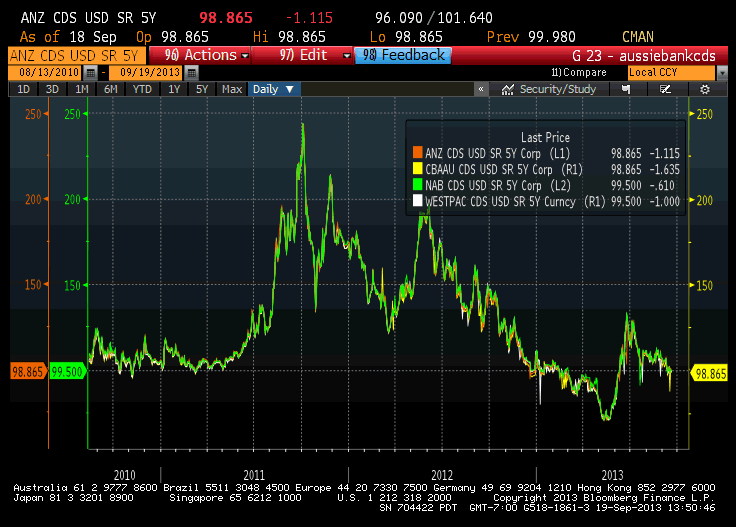
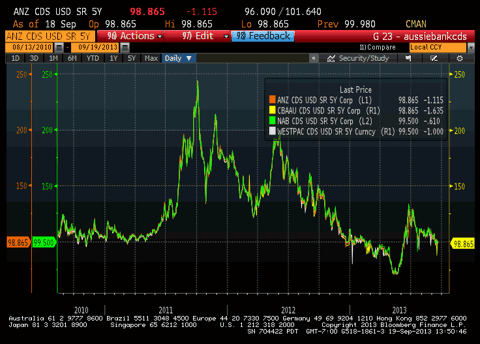
5-year CDS on Australia's 'big four' banks. Commodity cycle peaked? Australia's housing bubble in trouble? No problem, now that Ben is promising to continue pumping as before.
.
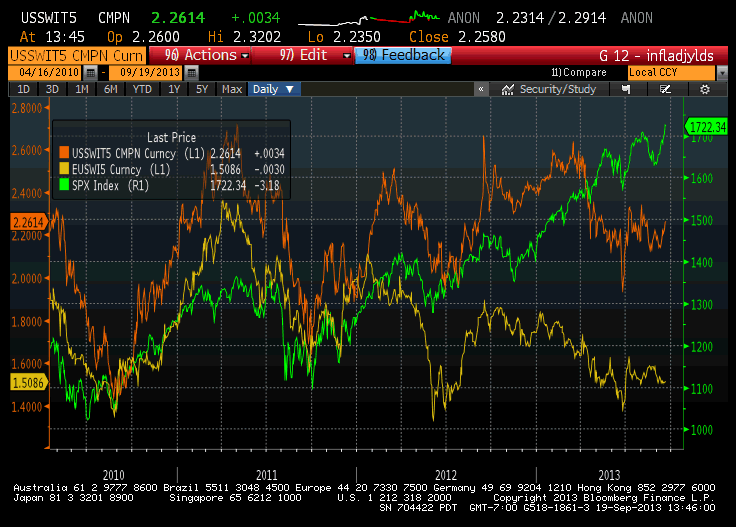
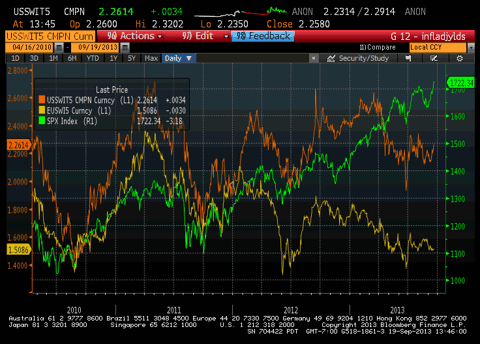
And lastly, 5-year 'inflation expectations' in the U.S. (orange line), the euro area (yellow line) vs. the SPX (green line). Current market-based inflation expectations (this is to say, expectations regarding future rates of CPI based on the yield difference between inflation protected and nominal bonds) are bizarre. We continue to believe that in the US, they are mainly out of whack due to the forced unwinding of leveraged positions in TIPs. In the euro area, market participants seem to think that the recent acceleration in money supply growth won't matter, as bank credit growth has gone sharply into reverse again. It remains to be seen what comes of this.
Charts by: Bloomberg
0 comments:
Publicar un comentario