$1,300 Gold Is A Gift
Sep 25 2013, 15:45

Recently an article was published arguing that the downtrend in gold (GLD) that began in September, 2011 was the beginning of a long gradual bear market. The author provides the following "arguments":
1) Technically the rise in gold from 2002 to 2011 is similar to the rise in gold from 1971 to 1980. It will therefore follow the trajectory that we saw from 1981 onward.
2) As the Federal Reserves "tapers" and ultimately tightens this will have a negative impact on gold, and gold should see negative price action similar to that seen in the 1980s.
3) Gold's inflation-adjusted returns from 2002 to the present day have been excessive, and consequently unsustainable.
Each of these arguments is flawed, as I will demonstrate.
1: Technically the rise in gold from 2002 to 2011 is similar to the rise in gold from 1971 to 1980. It will therefore follow the trajectory that we saw from 1981 onward.
In presenting this argument the author provides the following chart.
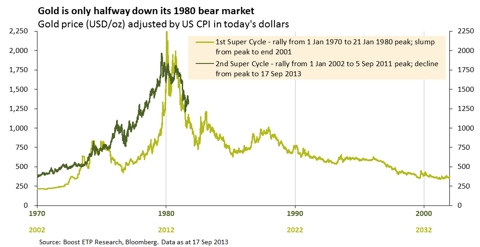
Aside from the more general flaw of the argument that correlation does not imply causation (i.e. just because it happened in the 1980s doesn't mean it will happen again), the similarity that the author is pointing out simply doesn't exist in the way he implies. First, the rise in the gold price from 2002 of about $300/ounce to the 2011 "peak" of $1,900/ounce is a mere 533% increase. The rise from $35/ounce in 1971 to $850/ounce in 1980 is a 2,330% increase. The author explains that the rise in the 1970s was more pronounced than the more recent one because inflation was higher back then. As I discuss below this is simply not true. The bull market in the 1970s saw an initial rise in the first part of the 1970s, followed by a substantial correction (not unlike the one we are currently seeing), only to see a phenomenal 8-fold increase over just 5 years. I should also point out that while the gold price peaked at $850/ounce, gold barely traded in the $700s and $800s. The bull market ended in a mania where the price was rising substantially every day. The top that was formed in 2011 was the result of a modest price rise from about $700/ounce in 2008 to $1,900/ounce three years later. There was no blow-off top or spike to suggest that the final top was in as there was in 1980. In fact as recently as last year the price reached within 10% of the all-time high.
Second, the author's timelines for both bull markets are conveniently similar in duration. A more detailed analysis of the two bull markets shows that this is inaccurate: the earlier bull market was far longer. While the earlier gold bull market seemingly began in the early 1970s, to assert this is to demonstrate a lack of understanding of the gold market during the Bretton Woods Era, and the period immediately following. The reason that the bull market in gold did not begin earlier is that it was fixed at $35/ounce by the Bretton Woods Agreement, whereby countries that stored their gold in the United States in order to keep it safe from the Nazis during World War 2 agreed to accept U. S. Dollars for their gold with the understanding that their dollars could be exchanged with the United States for gold at a rate of $35/ounce. While the $35/ounce price was officially renounced on August 15, 1971, when president Richard Nixon closed the gold window (effectively ending the Bretton Woods agreement), a market that was separate from America's $35/ounce price fix was operating for years before this. The following chart shows that the gold price began to fluctuate to higher levels as early as 1968.
(click to enlarge)
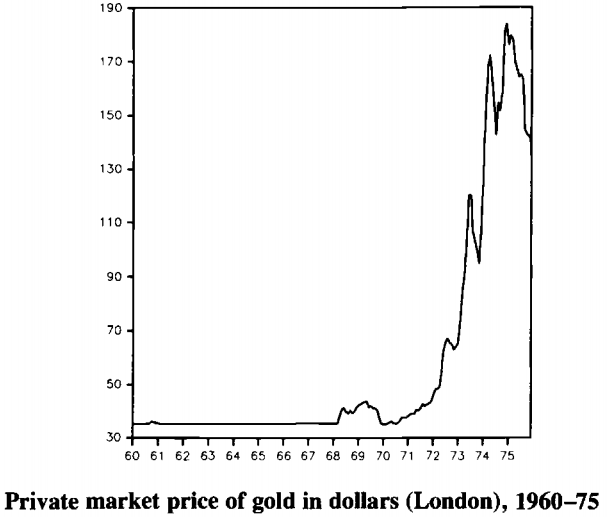
(Source: A Retrospective on the Bretton Woods System: Lessons for International Monetary Reform).
We can go back even further and find a brief price spike to $38/ounce in 1960.
(click to enlarge)
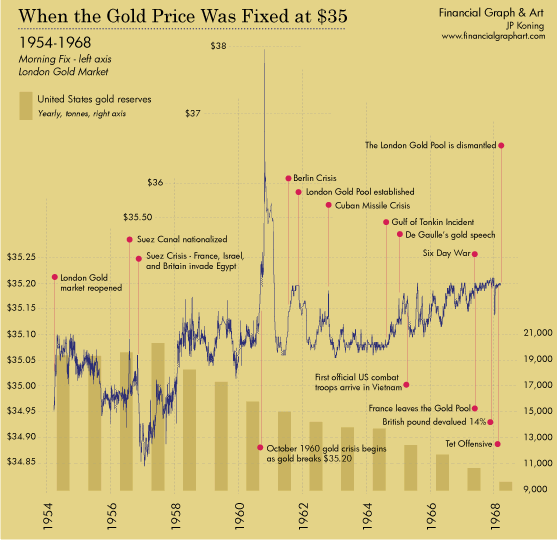
In addition to finding price movements, which were ultimately curbed in order to save the Bretton Woods Agreement, we can pinpoint the beginning of the earlier gold bull market on significant historical events, such as de Gaulle's proposal to return to the gold standard in 1965.
While it is impossible to re-write history it is fairly clear that the gold bull market would have begun long before 1971 if the price of gold were not pegged to $35/ounce by the U. S. Government. Therefore the timeline parallel is unfounded, and, like most bull markets, the ongoing one in gold should last for several more years.
2: As the Federal Reserves "tapers" and ultimately tightens this will have a negative impact on gold, and gold should see negative price action similar to that seen in the 1980s.
There are two issues with this argument. The first is that there is no evidence whatsoever that the Federal Reserve has any intention of "tapering" or tightening. The Fed has been grossly misleading when it comes to their quantitative easing policies, and the past four years have been peppered with Fed claims that these programs would cease. Of course they have just gotten bigger. Until there is evidence to the contrary, there is no reason to believe that this pattern will shift. Assuming that it continues we will likely see more quantitative easing in the future, not less.
Second, let us suppose that there will be tapering and eventual tightening. Historically there is no evidence that this will cause the gold price to fall. Had our author shorted gold upon Fed tightening during the last gold bull market he would have done horribly. As the following chart of the Fed's benchmark interest rate shows, he would have shorted gold into the end of the mid 1970s correction that was followed by an 8-fold increase in the gold price.

.
Not only can gold rise in the face of tightening, but note how high interest rates were during this time frame. Even an enormous amount of tightening in today's market wouldn't stop the gold bull run--as the chart shows it can rise in the face of mid to high single digit interest rates. Seeing that the earliest that rates will rise is 2015-16 (assuming you believe the Fed's comments), we will almost certainly not see rates as high as those seen in the 1970s for many years after that. Thus the gold price can rise for many more years, and quite substantially at that.
3: Gold's inflation-adjusted returns from 2002 to the present day have been excessive, and consequently unsustainable.
There are several issues with this argument. First, what are excessive returns? Second, there is no reason why any level of return is unsustainable. Investors who decided to sell an asset on the basis that it had risen too much in value would have missed out on enormous opportunities from Intel to Apple, to Silver Wheaton. Third, the author basis this claim on the CPI, which is the Bureau of Labor Statistics' measure of inflation. As I argue extensively in this article, the CPI grossly understates inflation. I will not go into the details here, but to summarize:
1) The rate of inflation is much higher than the CPI implies. It is probably in the mid to high single digits, and some people might experience a higher "personal" inflation rate. This is evidenced through price data of several essential items that people must buy.
2)The BLS uses two tricks to lower the CPI: hedonic adjustments and substitution. The first is based on the argument that as time goes by consumables get better, and therefore part of the price increase is the result of improvements, not inflation. The second is based on the argument that if prices rise for some things, then consumers will switch to consuming other things. While both arguments seem to make sense I argue that they do not, and that they serve to lower the stated inflation rate.
3) The government has incentive to have the BLS understate inflation. It has several expenses that are tied to the stated inflation rate such as COLAs to social security beneficiaries and interest payments on inflation protected securities. Therefore one should look to another party for data on inflation.
While the gold price has risen in inflation-adjusted terms, as I estimate inflation to be (about 6%-7%), the return has been rather modest. Further, if we consider that there was inflation while the gold price was falling in the 1980s and 1990s then gold has a lot of catching up to do.
Conclusión
With the gold price sitting just above $1,300/ounce, down from over $1,900/ounce two years ago it is no wonder that there is so much pessimism in the market. But we have established, contrary to the bearish viewpoint:
1) The gold bull market is still relatively young, and it has yet to reach a point of manic buying.
2) Gold bulls have little to fear from the Federal Reserve. Even if it surprises me and tapers and tightens this is no reason to sell your gold. In fact, if the last gold bull market can tell us anything, it is that we can potentially see enormous gains in gold while the Fed is tightening.
3) Gold has certainly performed well over the past decade, but this is no reason to sell it. While it has outpaced inflation, it hasn't done so by much, and it has to catch up for the inflation that was created during the bear market of the 1980s-1990s.
With that being said we can certainly see further price declines in gold. In the 1970s gold fell by 50% in the middle of the bull market. One more down-leg would not be surprising. But this is an ideal time to be accumulating. In 5 or 10 years it won't matter much whether you bought at $1,200/ounce, $1,300/ounce, or even $1,600/ounce, because the price will be much higher. With that in mind $1,300/ounce gold is a gift.
0 comments:
Publicar un comentario