Buttonwood
A misleading model
Low bond yields have in the past been bad, not good, for equity returns
Aug 3rd 2013
BULLS tend to find all sorts of reasons for forecasting a higher stockmarket. This is especially true of investment-bank strategists, whose bonuses are likely to get bigger when share prices are rising.
Low bond yields are often seized on by equity bulls. A recent research note from Deutsche Bank, for example, suggested there was a straight trade-off between changes in bond yields and the valuation of shares, in the form of the price-earnings ratio or “multiple”. Lower bond yields mean a higher multiple; based on current yields, shares are cheap.
.

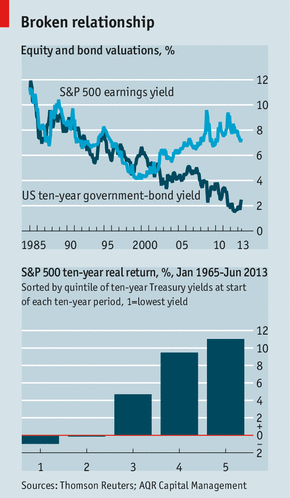
It is all remarkably reminiscent of the so-called “Fed model”, much loved by bulls in the 1990s. The model was based on a reference in Alan Greenspan’s 1997 congressional testimony to the close relationship between the ten-year bond yield and the earnings yield (the inverse of the price-earnings ratio) on the S&P 500 index. If the earnings yield was higher than the bond yield, then equities were cheap. Bond yields and earnings yields did indeed seem to move in tandem for about 15 years, and then the relationship broke down completely at around the turn of the century (see top chart).
The Fed model was a classic case of selective use of data. Since companies pay only a fraction of their earnings as dividends, the dividend yield is always lower than the earnings yield. But in the first half of the 20th century dividend yields were often higher than bond yields. Clearly, during that period, there was not a one-to-one earnings/bond-yield ratio. In practice, the Fed model worked for only a limited period.
But should it work in theory? The common rationale for the Fed model relates to the “discounted cashflow” approach to valuing equities. Lowering the discount rate you apply to future cashflows increases present value (the share price), other things being equal. The trouble is, other things aren’t equal.
Consider the reasons why bond yields fall. One possibility is that inflation expectations (and thus forecasts for nominal GDP growth) drop. Since profits should rise in line with GDP over the long run, then forecasts for profits growth must be downgraded as well. The same argument applies if bond yields drop because of fears about the pace of real GDP growth.
Bond yields are close to historic lows at the momento. You can argue about the role quantitative easing (QE) has played in pushing them lower, but in a sense it makes no difference. Central banks have pursued QE because they are worried about the growth outlook.
Slow growth is not great for profits. In other words, the rate for discounting future profits may have fallen but the same applies to the expected pace of profits growth.
Nevertheless, it seems irrefutable that equity prices have been pushed higher during the QE process. The prospective returns from government bonds look so paltry that investors have been forced to buy risky assets, including shares. But have equity investors been sold a pup?
A 2002 paper called “Fight the Fed Model” by Cliff Asness, one of the founders of AQR, a fund manager, argued that “the Fed model has no power to forecast long-term real stock returns.” His colleague, Antti Ilmanen, has updated the data (see bottom chart).
The period 1965-2013 is sorted by quintiles, based on the Treasury-bond yield at the start of each ten-year run of S&P 500 returns within that overall period. Future real equity returns were negative when bond yields were at their lowest and high when bond yields were highest. The great 1982 equity bull market started off with bond yields in the double digits. In other words, the Fed model was actually a contrarian indicator.
In an odd way, this makes sense. A naive belief in the Fed model makes investors push up equity valuations when bond yields fall.
Over the long run valuations tend to revert to the mean. So buying when valuations are high leads to lower-than-average real returns. The bulls connive in their own destruction.
0 comments:
Publicar un comentario