After The Fed: The Battle Lines Have Been Drawn
Jun 20 2013, 02:03
by: Eric Parnell
The importance to risk assets of the Fed's balance sheet expanding monetary stimulus programs simply cannot be understated. Basically, when the Fed is engaged in daily outright U.S. Treasury purchases, stocks and other related categories have risen almost without interruption and often without fundamental support. But the moment these programs are removed, stocks have shown the propensity to fall quickly back to earth regardless of the economic or market backdrop. It is for this reason alone that investors so anxiously anticipated today's news.
Dissecting The Fed
So what do we now know and what can we essentially infer coming out of today.
First, the Fed's baseline plan is to begin scaling back asset purchases later this year. So what does later this year mean? Almost certainly following the Fed's September 17-18 meeting barring some major shift in the economy or markets between now and then. Why September? Because unlike the October meeting, the September gathering has a press conference tied to it where Bernanke can elaborate more on exactly what the Fed had planned for the unwind. And they are unlikely to wait until December 17-18 right before the holiday season to spring this type of news on the market. So September is the likely start date for tapering.
Second, the Fed plans on ending the program in mid-2014. What exactly does this imply? That the Fed is almost certainly targeting to fully exit the program by the June 19-20 meeting next year, most likely having the program run through the end of that month.
This gives the Fed two press conference meetings on April 24-25 and June 19-20 to try and soothe the market as it wraps everything up. Of course, someone else is likely to be in charge of the Fed by then. But with this thought in mind, I'll simply put it this way - it is very likely that President Obama's comments about Bernanke on Charlie Rose were not off the cuff but instead were part of a collaborative plan between the two to help pave the way for Bernanke to begin making his way to the exits. Maybe it didn't come off that way, but these types of things often don't just happen in interviews by accident. And I will be very surprised if it isn't Fed Vice Chair Janet Yellen, who by all accounts is a firm supporter of Bernanke's policy program, sitting at the helm of the Fed at this time next year. Thus, anything that Bernanke is talking about now and Yellen might be continuing to talk about given Bernanke's absence in Jackson Hole in August is all likely part of the same plan.
Third, the Fed plans on scaling back asset purchases in stages. These stages are very likely to be announced at each policy meeting so that the Fed can "monitor the progress of the economy and markets along the way". Given that there are seven FOMC meetings between now and June 2014 and the final meeting would presumably be the one where the Fed is taking QE3 asset purchases to zero, this suggests that the Fed is likely to scale back asset purchases at the rate of $10 billion to $15 billion at each meeting.
Fourth, it seems highly probable that the Fed is likely to scale back on U.S. Treasury purchases first and MBS purchases later. During the meeting, Bernanke made the point of specifically highlighting the fact that the Fed "will not sell agency mortgage backed securities (MBS) during the process of normalizing monetary policy". Implicit in this statement is the fact that the Fed will opt to instead sell U.S. Treasuries during the process of normalizing monetary policy. Taking this thinking a step further, if the Fed is inclined to sell Treasuries first before selling MBS in the policy normalization process, they are also likely to opt to stop buying Treasuries first before ending purchases on MBS in the tapering of existing asset purchases.
Putting all of this together, it suggests that the Fed plans on ending outright U.S. Treasury purchases by the end of 2013 and wrapping up MBS purchases by next summer. This point is particularly important to markets for one critical reason. For it is daily U.S. Treasury purchases, not MBS purchases, that cause stocks to euphorically drift higher seemingly every trading day. This is due to the fact that Treasury purchases settle the next trading day and the cash is delivered by the Fed, while MBS purchases can take up to a few months to settle and only occur on three specific days each month. The following chart of the S&P 500 since last September illustrates the difference for stocks.
(click to enlarge)
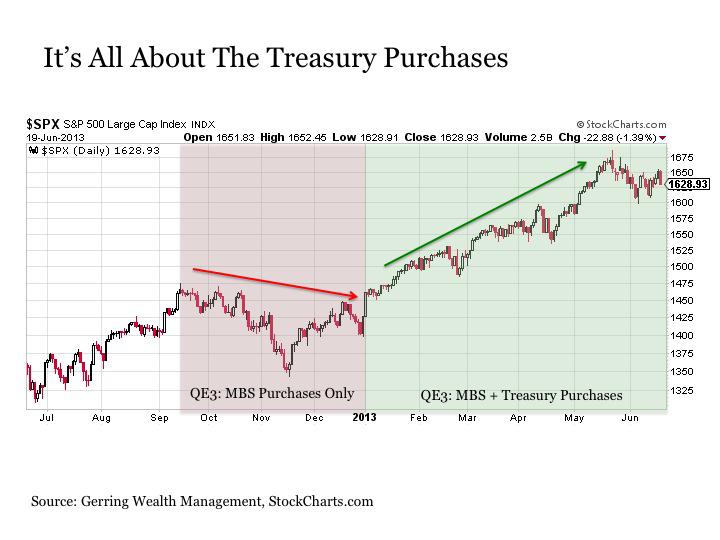
In short, the key news coming out of today is that QE3 now has an end date. And it seems when piecing all of the evidence together that the key component in U.S. Treasury purchases is likely to be finished by the end of 2013.
Implications For Stocks
Even if Treasury purchases continue under QE3 through the end of the year, doesn't this still suggest that stocks (SPY) have another six months to continue drifting higher before the party comes to an end? Perhaps this will be true, but recent history suggests that the stock market may begin to struggle from here.
The last time that the Fed was conducting daily outright U.S. Treasury purchases was during QE2 from November 2010 to June 2011. Under this program, the Fed was purchasing Treasuries at a rate of $80 billion per month on average, which is nearly double the current rate of $45 billion per month.
These previous purchases under QE2 were also taking place at a time when corporate earnings were still rebounding at a healthy double-digit rate both sequentially and year-over-year versus the flat to declining earnings growth in today's market. Moreover, the price-to-earnings ratio on stocks based on as reported earnings basis were still in the 15 times earnings range then versus the 19 times earnings levels today. And even with this far more favorable backdrop then relative to today, stocks traded sideways at best for the last six months of the QE2. And we all know what happened not long after QE2 ended in June 2011.
(click to enlarge)

The Battle Lines For Stocks Are Now Drawn
With all of this being said, stocks are still technically strong and putting up a good fight even after Wednesday's sell-off. But the battle lines are now clearly drawn for stocks as we move forward. And we could see stocks square off at any of these levels as soon as the next few days, perhaps next week, or maybe not until the start of the new quarter in July.
(click to enlarge)
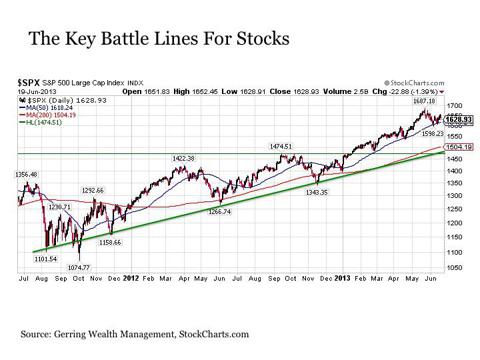
The first key level for stocks is the 50-day moving average (blue line) currently at 1618 on the S&P 500. This has represented firm support on a number of occasions since the beginning of the year when Treasury purchases were added to QE3. But if this support is breached, little stands in the way of preventing stocks from making a quick and decisive move lower.
The next support level is the 200-day moving average (red line) currently at 1504 on the S&P 500. Stocks have shown the propensity to find support at or just below this longer term support level before rebounding.
And if this level is breached, fairly strong technical support kicks in around the 1475 range, which marks the previous cycle high as well as the current upward sloping trend line that stretches all the way back to early 2009.
For those looking for a correction to rejuvenate stocks, it is worthwhile to put these support levels into context. A correction back to the 50-day moving average would only represent a -4% correction from recent peaks. This would not qualify as a meaningful cleansing for stocks. A move to the 200-day M.A. would represent a more substantial -11% decline from the peaks. And a pullback to the 1475 range would push the correction toward the -13% range. These latter two scenarios are levels that may help draw capital back into the market and at a minimum help establish a trading range for the remainder of the year between 1475 and 1675 on the S&P 500.
We will know a lot more in the coming days about whether stocks can continue to fight higher or if they are about to enter into a corrective phase and/or trading range going forward through the rest of 2013. And the fight at the 50-day M.A. will be most important in this regard, for if stocks break decisively lower below this support level, the correction or trading range scenario is likely to follow.
Battle Lines Across Asset Classes
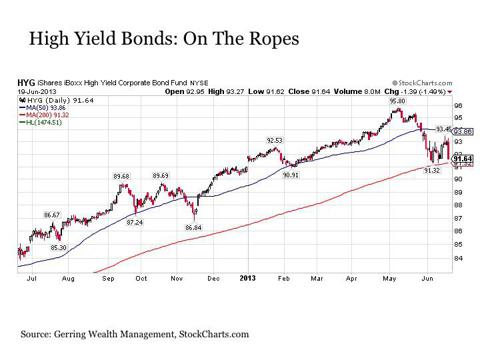
Asset classes that are highly correlated to U.S. stocks now face a similar threat going forward. Both REITs (VNQ) and high yield bonds (HYG) have already sliced through the first lines of defense and are now testing support at their respective 200-day moving averages. Any decisive break lower from here for either category would bode ill for U.S. stocks, as it would suggest that the overall bullishness supporting the risk asset rally is starting to break down.
(click to enlarge)

(click to enlarge)
The same holds true for the preferred stock market (PFF). After having already cut through its 200-day moving average, it managed to claw its way back to reclaim this support level in the last few trading days. But just like REITs and high yield bonds, any break lower here by preferreds would likely foreshadow pending weakness for stocks.
(click to enlarge)

What About Bonds?
Much has been made about the investment grade bond market and the threat of rising interest rates going forward now that the Fed is proposing to end its asset purchase program in the months ahead. As discussed in a previous article, I believe the declaration of doom for the bond market is very premature, particularly given the lackluster growth outlook. Moreover, the lack of any money velocity among a variety of other factors remains highly supportive of bonds, as we would likely need to see a meaningful pick up in the velocity of money before seeing rates spiral out of control.
(click to enlarge)
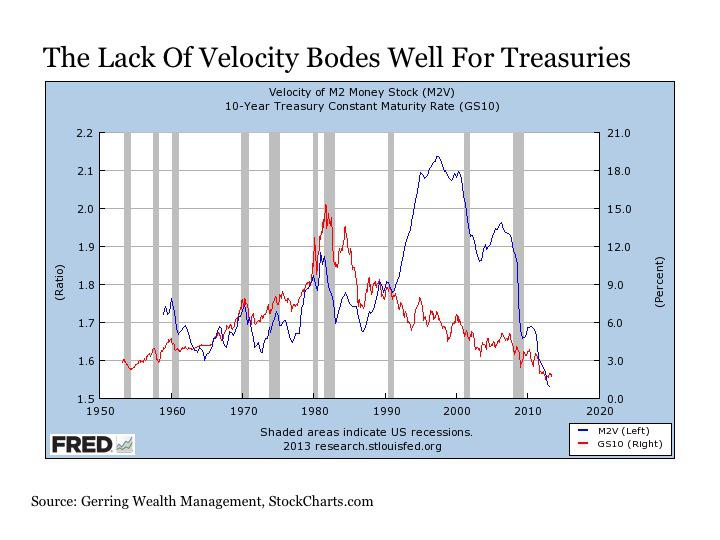
And for those questioning who is likely to buy these bonds once the Fed steps away, the answer likely resides in whoever was buying these bonds from July 2011 to December 2012 when the Fed was out of the picture and yields dropped from over 3% to below 1.4% on 10-Year U.S. Treasuries.
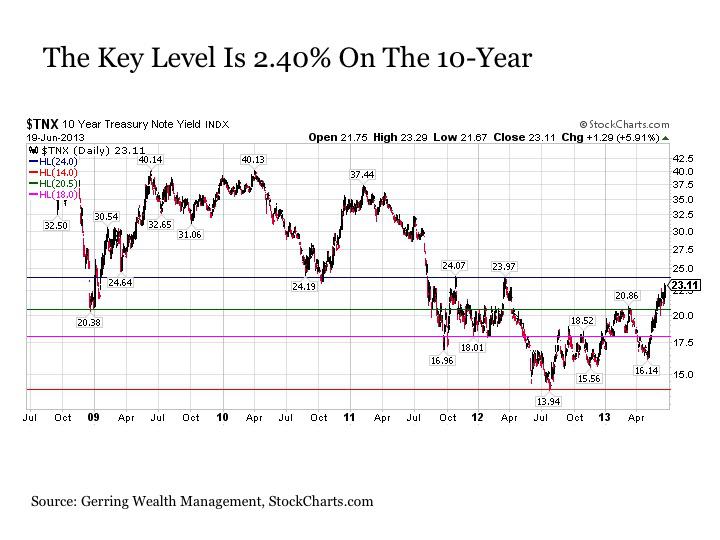
But with all of this being said, if the 10-year U.S. Treasury yield breaks decisively above 2.4% in the coming days or weeks, it would signal that a definitive change has taken place in the bond market (AGG), regardless of whether it has to do with tapering or the liquidation of Treasuries by foreigners.
(click to enlarge)
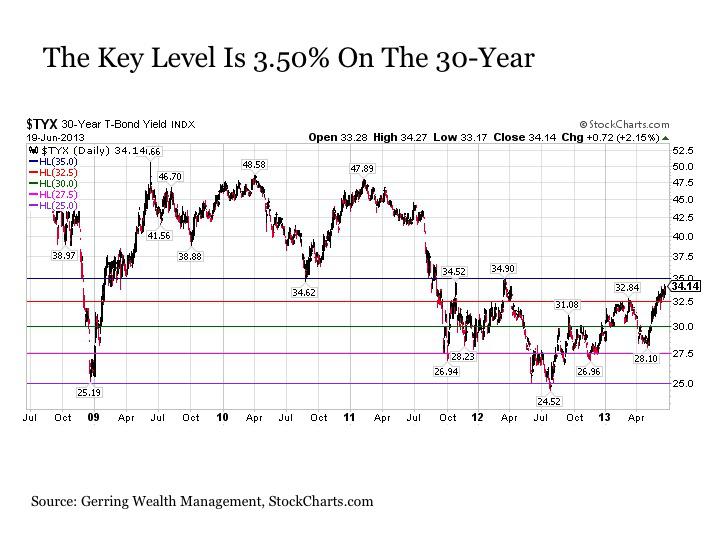
The same principles hold true for the long end of the yield curve. At present, the key threshold for the 30-year U.S. Treasury yield is 3.5%. If rates break out above this level, it should be noted as it relates to long-term bond holdings (TLT).
(click to enlarge)
On a final note, the Build America Bond (BAB) market is currently right up against a critical support level at its 400-day moving average. Any decisive break below this level in the coming days should warrant very close attention.
(click to enlarge)

However, if bonds can hold these support levels, the upside rebound potential across the quality bond complex is fairly substantial as interest rates regress toward the mean of their recent ranges if not beyond.
How About The Precious Metals?
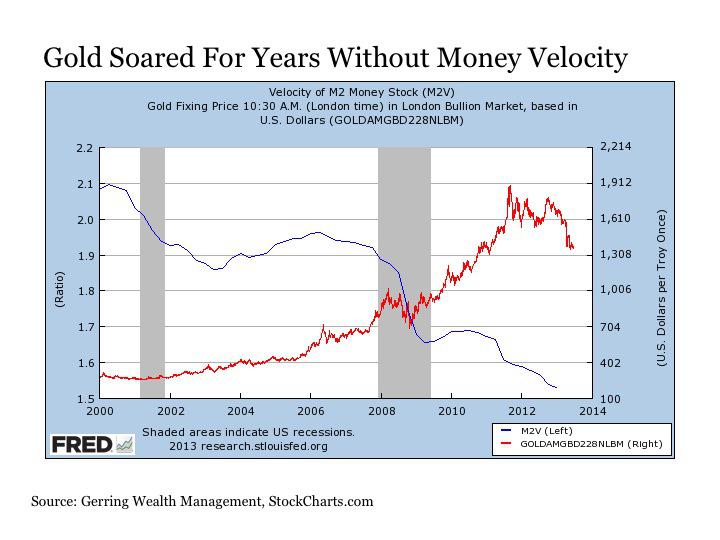
The pain in both gold (GLD) and silver (SLV) has been well documented over the last several months. As discussed in a previous article, these metals do not necessarily need QE to move higher. Nor do they need consistent inflationary forces to move higher (see charts below). After all, gold was so much in demand during the deflationary Great Depression that owning the precious metal was declared illegal by the U.S. government in 1933.
(click to enlarge)
(click to enlarge)

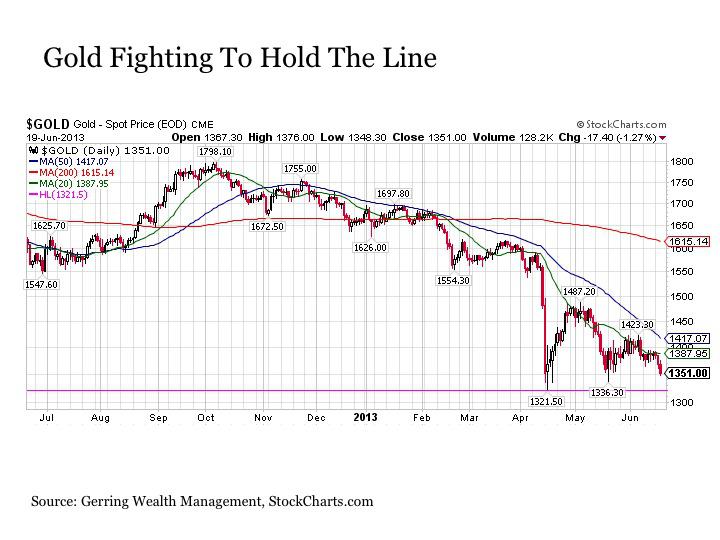
Instead, what gold and silver require more than anything else is the return of fear to financial markets. And there is certainly much to fear in today's environment. This may be fear of inflation, deflation, a weakening currency, money printing getting out of control or any other crisis that might erupt along the way. This does not mean that these precious metals cannot be liquidated short-term as evidenced by recent events in April, but they continue to serve a long-term purpose as a store of value and portfolio diversification. And while a variety of signs suggest that both metals are currently in an extended bottoming process, they need to break decisively above their respective downward sloping 20-day moving averages to start to turn things around. For just as stocks have a great deal of air to fill the downside, so too do gold and silver have air to fill to the upside. This is something else that warrants close attention in the days ahead.
(click to enlarge)
(click to enlarge)

Bottom Line
We have arrived at a critical juncture for investment markets including stocks, bonds and commodities. The battle lines have been drawn, and any definitive breaks in either direction in the coming days potentially have important implications both for the remainder of the year and beyond. I had previously raised cash levels ahead of the Fed meeting and may increase this allocation further depending on how events play out in the coming days. It promises to be a most eventful time for investment markets over the next few weeks.
0 comments:
Publicar un comentario