Expectations Continue To Clash With Reality
May 21 2013, 17:42
Even while Bloomberg reports that there is now widespread conviction (as a result of rising stock prices no doubt) that the US economy is about to achieve "escape velocity" - whatever that is supposed to mean - economic data continue to disappoint with unwavering regularity.
One of the fund managers interviewed by Bloomberg even went as far as asserting that "anyone who isn't long real estate is a moron" (Bloomberg's pushing of establishment approved memes couldn't possibly be more blunt than it has recently been). However, as Ramsey always points out in these pages, it is Wall Street money that is pushing house prices up - there is very little organic demand from owner users.
The ongoing series of disappointing economic data was joined yesterday by yet another decline in the Chicago Fed's National Activity Index (CFNAI), which fell from -0.13 in March to -0.53 in April. Any readings below zero indicate economic contraction. According to the Chicago Fed's web site:
The Chicago Fed National Activity Index (CFNAI) was -0.53 in April, down from -0.23 in March."The CFNAI is a weighted average of 85 existing monthly indicators of national economic activity. It is constructed to have an average value of zero and a standard deviation of one. Since economic activity tends toward trend growth rate over time, a positive index reading corresponds to growth above trend and a negative index reading corresponds to growth below trend.The 85 economic indicators that are included in the CFNAI are drawn from four broad categories of data: production and income; employment, unemployment and hours; personal consumption and housing; and sales, orders and inventories. Each of these data series measures some aspect of overall macroeconomic activity. The derived index provides a single, summary measure of a factor common to these national economic data."
We hasten to add that such broad macro-economic aggregates are not very useful gauges of the economy's true underlying health and cannot tell us whether the "activity" measured is actually economically sensible. What is remarkable and what makes it worth talking about it is that usually, whenever the Fed is engaged in heavy monetary pumping, such broad gauges of economic activity tend to reflect strength. Even if it is the phony strength of a bubble economy that produces phantom wealth while it consumes scarce capital in reality, such as the housing boom economy of 2002-2007.
The fact that these days such indicators of economic activity are often reported to be quite weak in spite of a huge monetary expansion is rather noteworthy. We believe it is an indication that the economy's pool of real funding has been weakened considerably by the last credit boom and likely didn't get a chance to be properly replenished due to the Fed adopting even looser monetary policies than before in the meantime.
In other words, before real savings had a chance to increase to the point where entrepreneurs would have had the wherewithal to embark on sound economic expansion once more by investing in longer, more roundabout production processes, they were enticed into new capital investmentswithout a corresponding increase in the pool of real savings. Too low interest rates and an overabundance of money (not to be confused with an overabundance of actual capital) are creating illusory profits in ventures that will once again turn out to have simply consumed existing capital once everything is said and done. If the pool of real savings is very weak, then even these illusions can probably no longer be maintained. Hence the fall-off in macro-economic aggregates of "economic activity" in spite of the current loose monetary policy.
(click to enlarge)
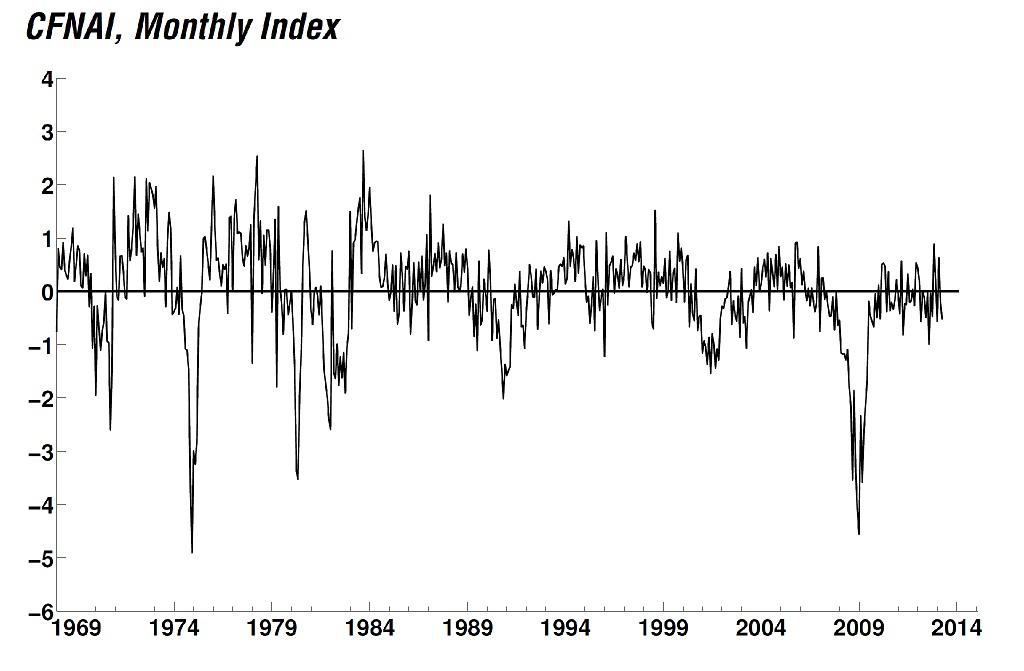
The monthly CFNAI index stands at minus 0.53 as of April. Obviously this is a quite volatile measure, but one can see on the chart that it has tended to be weaker overall in the post 2008 recovery than in previous recovery phases.
Incidentally, another decline in the growth rate of inter-modal rail traffic was also reported yesterday by the Association of American Railroads (viaBusiness Insider). Orcam Investment Research provides a chart of the 12-week moving average of the year-on-year change in rail traffic which you can see below:
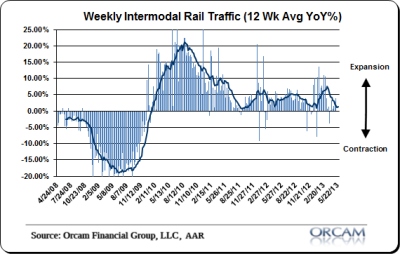
Inter-modal rail traffic growth, 12-week moving average.
These are just two in a string of weaker than expected economic reports that have been released in recent weeks (there was the occasional exception). Especially noteworthy in this context were the surprisingly weak regional manufacturing business activity reports published by various Fed districts recently.
Obviously the stock market doesn't care (yet). But if it is true, as many people apparently believe, that the market is forecasting a brighter future, then why has that bright future still not arrived? After all, the market has been forecasting it with nary an interruption for quite some time now. In fact, judging from the market's current nose-bleed levels, the future will be so bright we will all need to put on shades, as the saying goes.
Market Participants Remain As Optimistic as Ever
A measure of bullish sentiment which we haven't discussed in a while is the equity options put-call volume ratio. This is generally regarded as a contrary indicator, as opposed to the OEX put-call volume ratio. We are mentioning it because we have noticed it has just fallen to the lowest level in more than a year. Even lower levels are of course possible (0.40 is historically the lowest value one gets to see at times in a single day reading), but the current level of 0.50 certainly testifies to a great deal of enthusiasm among option traders.
(click to enlarge)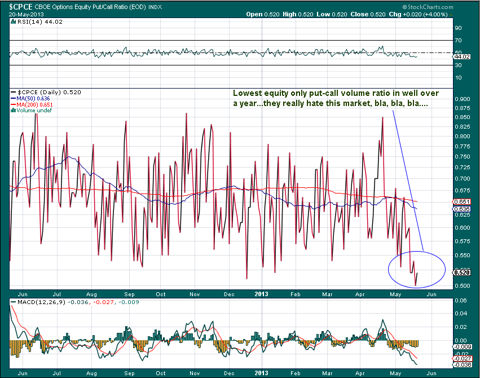

More signs of how "unloved" the market is - the equity put-call volume ratio plummets to a new 52 week low, with nearly twice as many calls as puts bought.
Conclusion
The gap between economic reality and the perceptions of market participants is widening ever more. This may well continue for a while longer, but it is a good bet that at some point, something will have to give. If our suspicion that the economy's pool of real funding is under severe strain should prove to be correct (since we cannot measure it, we can only infer what the situation is by means of circumstantial evidence), then the stock market is threading on very thin ice indeed. In recent months the highly imbalanced ratio of capital versus consumer goods production has leveled out. The current height of this ratio indicates that the economy is tying up more consumer goods in investment in higher order goods production than it releases. Usually when the imbalance becomes as severe as it currently is, a rise in consumer goods prices has either already begun or is not too far off. The Fed would normally already be in the process of raising its administered interest rates. Usually it would thus also indicate that a bust must be expected to begin fairly soon. We will see how things play out in the current environment, in which consumer price increases have so far reportedly remained quite tame and the Fed continues with monetary pumping on an unprecedented scale. We would suggest that a nasty surprise is probably just around the corner.
(click to enlarge)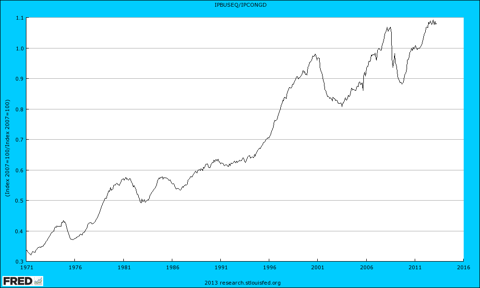

The ratio of business equipment (capital goods) versus consumer goods production: stagnating a bit of late near a record high level. Economic busts usually see a decline in this ratio. This happens because the economy adjusts during busts as a result of the discovery of much malinvested capital and the unsound credit supporting it. The production structure is temporarily shortened as factors are shifted from higher order to lower order stages of production, until real savings have been built up sufficiently again to allow for renewed investment in production more remote from the consumer.
Charts by: Chicago Fed, St. Louis Fed, StockCharts, Orcam Research.
0 comments:
Publicar un comentario